

A key challenge for pollsters in projecting electoral outcomes is accounting for the composition of voter turnout. Often, the political preferences of lower-turnout voters will systematically differ from those of active voters. Therefore, polls that sample all registered voters will overweight the preferences of the lower-turnout population, while polls that restrict attention to active voters will overcorrect for this bias. The appropriate solution is to sample the full voter population and then weight responses by voter turnout probabilities.
The Unrivaled Politics Turnout Scoring Model is designed to forecast participation rates in an upcoming election for Pennsylvania registered voters. The current version (version 2) of the model is based on analysis of voter turnout behavior during the 2024 General Election, using Pennsylvania Department of State’s “Full Voter Export” (FVE) file as of January 20, 2025.
The modeling procedure segments voters eligible to vote in that election (who were registered as of the registration deadline for that election) based on their:
- Voting history (history of participation in prior elections), including the spring 2024 Primary Election
- Active versus inactive status as assessed by election officials as of June 1, 2024
- Party Affiliation
- County of Residence
- Age Group
Each segment’s turnout score is then calculated as its observed participation rate in the 2024 General Election. Note that this procedure is analogous to how credit reporting agencies develop and assign credit scores based on credit histories.
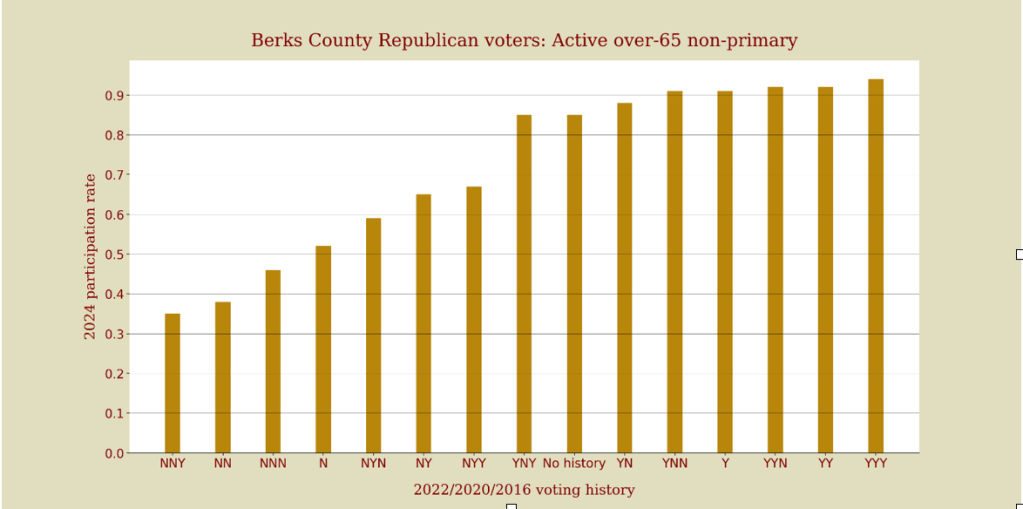
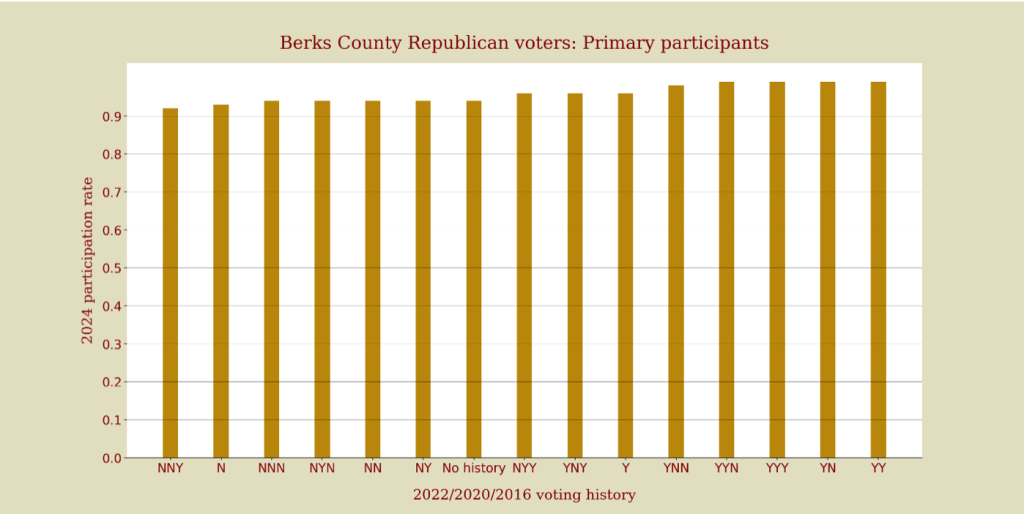
The turnout model is illustrated in Figures 1 and 2, which show calculated turnout scores for various segments of Republican voters in Berks County. Figure 1 shows turnout scores by voter history segment for the cohort of over-65 active voters who did not vote in the Primary. Figure 2 shows the turnout scores of Primary voters. Note that among Primary voters, the model makes no distinction between active and inactive (a change from version 1) due to inactive being thinly populated, nor between age cohorts due to lack of a material relationship.
As seen in the charts, score segments are based on voter history covering the 2016, 2020, and 2022 General Elections. Note that voters who registered after 2022 are slotted to the “no history” segment, as they have no prior history (other than Primary participation status). Those who registered after 2020 are assigned to segment “Y” if they participated in the 2022 election and to “N” if they did not; those who registered after 2018 are assigned to “YY” if they participated in both 2020 and 2022; and so forth.
In application of the model to predict turnout for the upcoming General Election (2026), voters would be slotted to segments based on analogous criteria and assigned that segment’s calculated turnout probability. For instance, those who vote in the 2026 Primary will be slotted into the cohort of Primary participants. Similarly, those who have participated in all three prior General Elections (2024, 2022, and 2020) but not in the Primary would be slotted to the YYY cohort.
The turnout scores for the active, over-65, non-Primary voters in Figure 1 range from 0.35 to 0.95. Not surprisingly, turning out in prior elections is associated with relatively high participation rates in the 2024 General Election. The turnout scores for Primary voters in Figure 2 consistently exceed 0.9 and show a mild relationship to voter history.
Figure 1: Berks County Republican Voter Turnout Scorecard – Selected Segments
Predictive performance of the prior version
The previous, original version of the model , which projected turnout rates for the 2024 General Election, was based on observed participation rates by voter segment during the 2020 General Election.
As with any projection based on extrapolation from historical experience, realized outcomes can diverge from projections. Nonetheless, there are reasons to expect the model to provide reasonably accurate predictions, especially in regard to rank ordering of turnout likelihoods across segments. Voters who have tended to vote sporadically in the past typically will continue to do so. Those who rarely have missed an election almost surely will vote in the next one. Inactive voters have been classified as such by election officials for a substantive reason (such as failure to respond to an address verification notice) and correlates with relatively low likelihood of voting in the next election.
Table 1 reports the actual versus predicted turnout rates (panel A) and counts (panel B) by party affiliation, based on version 1 of the turnout model as applied to the voter population as of 10-21-2024. This “lookback analysis” demonstrates reasonably accurate model performance. For Republicans, actual turnout was very close to projected, while for Democrats it was 1.5 percentage points higher than projected.1
Whereas the model projected a turnout advantage of about 110,000 for Republicans over Democrats, the realized margin was only about 50,000. Of course, President Trump’s margin of victory was about 120,000, implying that he garnered a net 70,000 vote advantage among independent (those not affiliated with either of the two major parties) or cross-over voters.
Table 1: Prediction error by party affiliation — 2024 General Election
Turnout percentages
| Party | actual | projected | gap |
| Democrat | 0.794 | 0.779 | 0.015 |
| Republican | 0.857 | 0.858 | -0.001 |
| Independent | 0.678 | 0.694 | -0.014 |
Turnout Counts
| Party | actual | projected | gap |
| Democrat | 3,004,427 | 2,948,447 | 55,980 |
| Republican | 3,056,493 | 3,059,585 | (3,092) |
| Independent | 925,697 | 946,908 | (21,211) |
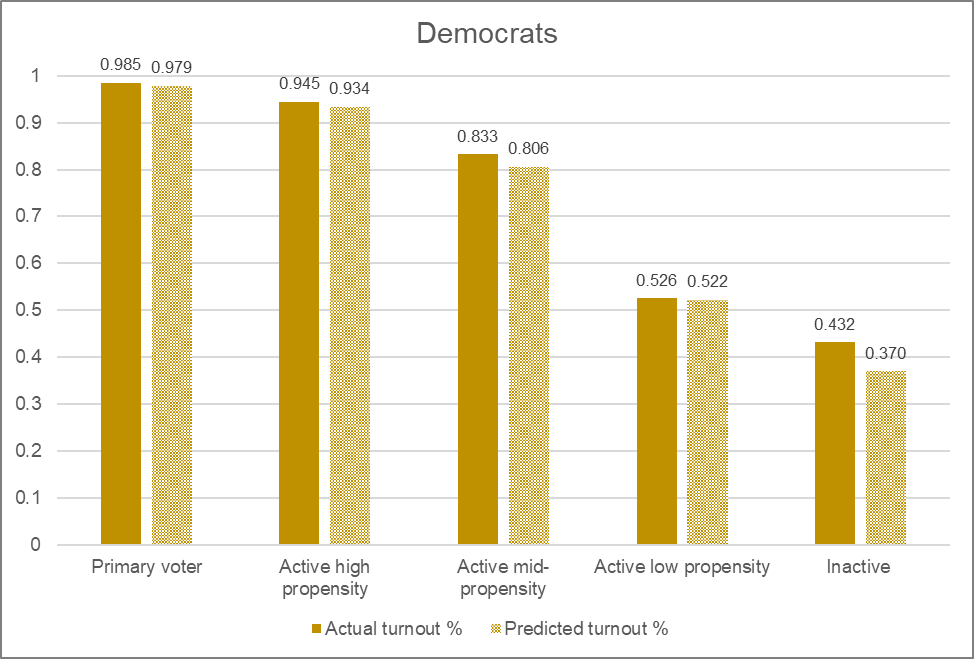
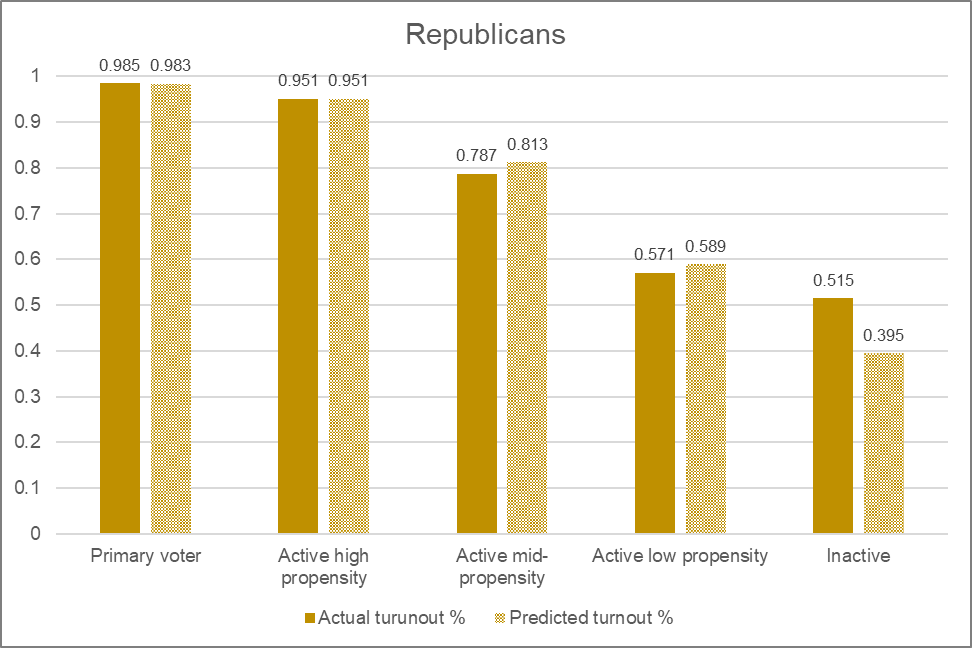
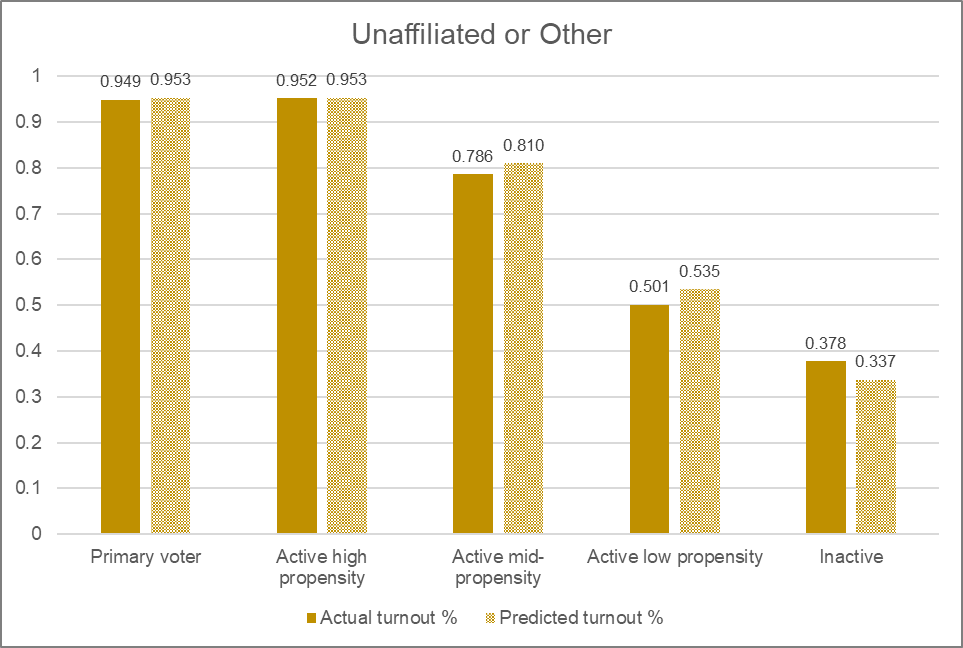
Figure 3 drills down to compare predicted and actual turnout rates by range of turnout likelihood. Predicted and realized rank orderings are well aligned, validating the underlying segment-level projections. The inactive segment exhibits the largest prediction errors, with actual turnout exceeding predicted by substantial margins for each party affiliation.
The latter result suggests that after 2020, the inactive voter classification came to be less precise at distinguishing voters who had exited the voting population. That is, assignment of voters to inactive status became more idiosyncratic (such as tied to voters relocating within the state and failing to update their registration data) and thus less reflective of actual exit.
Overall, this “look-back” analysis confirms the usefulness of the modeling approach based on segment-level turnout rates, which are seen to be highly stable. Version 2 refits the Turnout Scoring Model to the observed 2024 outcomes, adapting it to the shifts in voter characteristics or behavior driving the original version’s modest prediction errors.
Figure 3: Predicted versus actual turnout rate by prediction range and party
Simulated application to polling.
Accurate quantification of turnout likelihoods based on voting history and other factors—turnout modeling—can be used to generate more accurate predictions from polling results. This is because voter turnout probabilities may be correlated with their party affiliation or political views.
In Pennsylvania, this is clearly the case, as seen in Table 2, which shows raw and turnout-weighted counts by turnout score range and party affiliation as of 10-21-2024, where “high propensity” voters are defined as those with turnout probability of 90 percent or higher.
Table 2: Counts by turnout category and party affiliation
| Voter category | Democrat | Republican |
| Unweighted total | 3,785,262 | 3,568,022 |
| High propensity total | 1,766,285 | 2,185,622 |
| Lower propensity total | 2,018,977 | 1,382,400 |
| Participation-weighted count: high propensity | 1,698,955 | 2,109,738 |
| … turnout likelihood (ratio of weighted to unweighted count) | 0.96 | 0.97 |
| Participation-weighted count: lower propensity | 1,249,491 | 949,846 |
| … turnout likelihood (ratio of weighted to unweighted count) | 0.62 | 0.69 |
| Participation-weighted total | 2,948,447 | 3,059,585 |
Republicans outnumber Democrats among high propensity voters (those with turnout likelihood of 90 percent or higher) and vice versa among lower propensity voters. Even within the lower propensity segment, Republicans have a higher overall turnout likelihood. Consequently, Republicans have the higher participation-weighted count, despite that Democrats outnumber them in raw total count.
It follows that if differing turnout propensities are not accounted for, then polling is apt to produce biased predictions. Polls that randomly sample the full population will over-weight lower propensity voters, favoring Democrats. Polls restricted to “active voters”–whom in practice typically are identified based on a recorded history of frequent voting (though sometimes based on self-reported turnout likelihood)–will be biased in favor of Republicans. 2
Conversely, sampling the full population and weighting each voter’s response by the voter’s modeled probability of turnout will allow for more accurate predictions.
The potential magnitude of such biases, and the applicability of the Turnout Scoring model to correct for them, can be illustrated by means of a brief and simple simulation exercise. Using the FVE data as of 10-21-2024, we simulate a hypothetical poll for the 2024 General Election, based on random sampling 2,000 voters in Berks County, under the following set of assumptions characterizing the overall population:
- A symmetric 5 percent of voters in either major party favor the opposing party’s candidate (cross-over voters)
- Among voters not affiliated with either major party, 55 percent favor Harris with the remainder favoring Trump
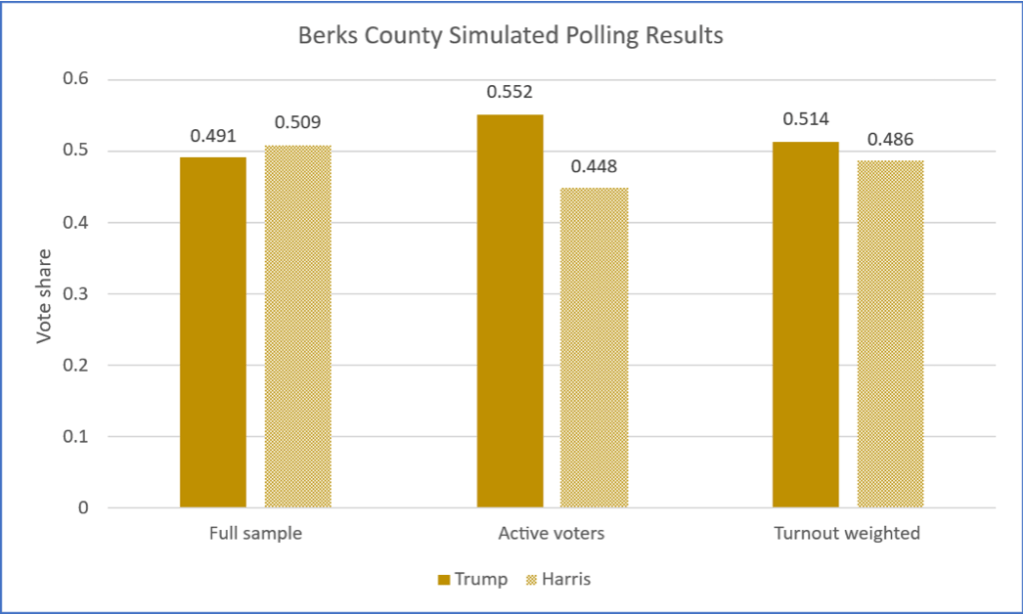
Figure 4 presents a typical simulated outcome. In the full sample without adjusting for turnout likelihood (the set of bars on the left side of the chart), Harris is favored by 51 percent of the population. This reflects the fact that the population contains an almost equal number of Republicans (41.1 percent of the simulated sample) and Democrats (40.4 percent), alongside the assumption that Harris is marginally favored among Independents in the full population.
When the sample is restricted to “active voters”, defined as those with a turnout probability of 80 percent or higher (the middle set of bars), Trump’s share rises to 55.2 percent, reflecting that Republicans outnumber Democrats in this cohort.3 Trump’s turnout-weighted share (right side of the chart), which most accurately captures the expected election outcome, sits in-between at 51.4 percent. Repeated iterations of the same simulation exercise yield similar results.
- A more detailed discussion of the model’s ex post performance can be found in our blog post on the subject. ↩︎
- For example, turnout bias may have been a contributing factor to why in Pennsylvania in 2024, Trump outperformed the predictions of most polls. ↩︎
- Active voters thus defined are roughly equivalent to voters who participated in the Primary or who turned out for the 2022 General Election. ↩︎
