

The Unrivaled Politics Turnout Scoring Model is designed to forecast participation rates in an upcoming election for Pennsylvania registered voters. The model was developed in advance of the 2024 general election using historical data from the Pennsylvania Department of State’s “Full Voter Export” (FVE) file (as of April 29, 2024), and has been applied to generate turnout predictions for that election. The model’s 2024 turnout probabilities were estimated using the subpopulation of the full FVE sample whose presence in the data predates (who have registration dates prior to) the registration deadline for the 2020 general election. 1
The estimation procedure segments these voters based on their history of participation in prior elections; on active vs. inactive status as assessed by election officials as of June 1, 2020; and on other voter characteristics including party affiliation, county of residence, and age cohort.2 Each segment’s turnout score is calculated as its observed participation rate in the 2020 general election. Note that this procedure is analogous to how credit reporting agencies develop and assign credit scores.
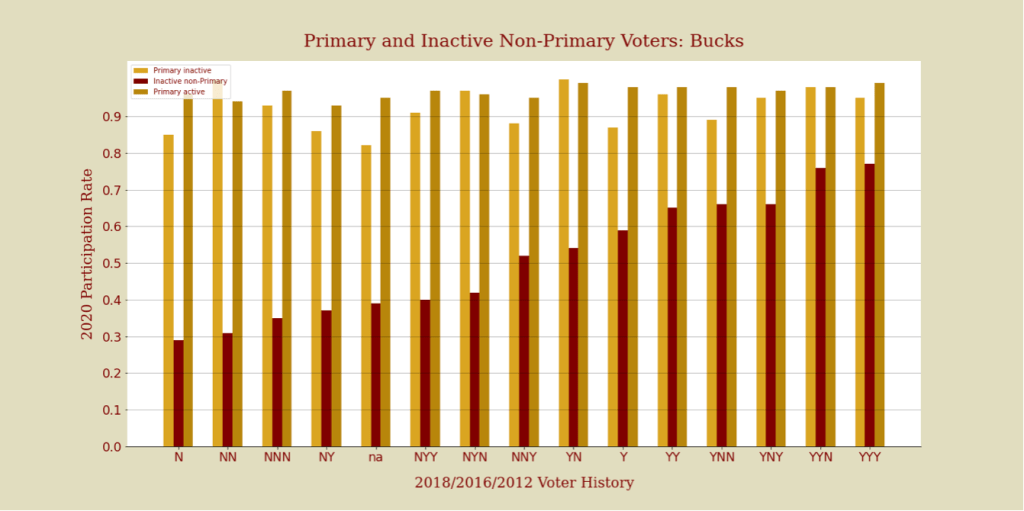
Figure 1 illustrates the turnout model for three segments of Republican voters in Bucks County. The three segments are based on activity status as indicated in their voter registration record and by whether they participated in the 2020 primary election.3
For each segment, the chart shows the participation rate in the 2020 general election in relation to voter history covering the 2012, 2016, and 2018 general elections. Note that voters who became registered after 2018 are assigned “na” for voting history, as they have no prior history in the data; those who became registered after 2016 are assigned a single “Y” if they participated in the 2018 election and an “N” if they did not, and so forth.
Not surprisingly, participation in the primary election is associated with relatively high turnout rates for the upcoming general election regardless of prior voting history. Turnout rates tend to be marginally lower for primary participants tagged as inactive compared to those tagged as active.
In contrast, voting history is a strong differentiator for inactive voters that did not vote in the primary. For this cohort, participation rates in the upcoming general election range between 25 and 80 percent, depending on history segment.
Figure 1: Bucks County Republican Voter Turnout Scorecard – Selected Segments
A simple application of the model
Turnout likelihoods for the 2024 election were inferred by applying the model to the contemporaneous voter population based on the segment in which they presently reside. A voter’s segment is determined by the voter’s participation status in the 2016, 2020, 2022 general elections and 2024 primary; on whether the voter is currently classified as active or inactive; and so forth. 4
Table 1 illustrates application of this procedure in the context of calculating raw and probability-weighted voter counts in the FVE population as of September 6, 2024. The table distinguishes between high propensity voters—those with 90 percent or higher likelihood of turnout, and others, and between the current population of lower propensity voters who were also present during the 2020 election and those who joined afterward.
Republicans outnumber Democrats among high propensity voters by more than 300,000. Because Democrats far outnumber Republicans among lower propensity voters, the raw, overall count (“unweighted total”) favors Democrats by more than 350,000. Interestingly, after adjusting for turnout likelihood, the Democrat advantage disappears. Turnout-weighted, each party has roughly 3 million voters, with Republicans ahead by a small, 36,000 margin.
Table 1: Raw versus Turnout-Weighted Voter Counts as of 9-6-2024 in Pennsylvania
| Counts by Voter Category | Democrat | Republican |
| Voter count: high propensity | 1,807,790 | 2,220,706 |
| … Subcount: Not present in 2020 | 52,074 | 54,920 |
| Voter count: not high propensity and present in 2020 | 1,794,334 | 1,071,958 |
| Voter count: not high propensity and not present in 2020 | 299,093 | 251,889 |
| Unweighted total | 3,901,217 | 3,544,553 |
| Participation-weighted count: high propensity | 1,735,081 | 2,140,361 |
| … turnout likelihood (ratio of weighted to unweighted count) | 0.96 | 0.96 |
| Participation-weighted count: not high propensity and present in 2020 | 1,068,470 | 707,675 |
| … turnout likelihood (ratio of weighted to unweighted count) | 0.6 | 0.66 |
| Participation-weighted count: not high propensity and not present in 2020 | 196,083 | 187,844 |
| … turnout likelihood (ratio of weighted to unweighted count) | 0.66 | 0.75 |
| Participation-weighted total | 2,999,634 | 3,035,880 |
- Thus, the estimation sample comprises only voters who were present in 2020 and have survived through 2024. We are unable to estimate a model using the full population that was present in 2020 because we lack access to archived FVE data from 2020. ↩︎
- Party affiliation and county of residence are as of the FVE file release date (April 29, 2024); age cohorts are defined based on birth year. ↩︎
- The model additionally incorporates various age segments of active non-primary voters ↩︎
- For example, an active Republican voter in Bucks County who registered after the most recent (2022) general election and voted in the 2024 primary would be slotted to history category “na” and assigned the same likelihood of voting in the 2024 general election as observed for a similarly situated voter in 2020. ↩︎
