
As described in a previous Unrivaled Politics blog post, the Pennsylvania Voter Turnout Model is designed to forecast participation rates in an upcoming election for Pennsylvania registered voters. The model was developed in advance of the November 5, 2024 election and has been applied to generate turnout predictions for that election. This article assesses the performance of the turnout model via a look-back comparison of projected to realized outcomes from that election.
The model segments voters based on their history of participation in prior elections; on active vs. inactive status as assessed by election officials; and on other voter characteristics including party affiliation, county of residence, and age. In the current version of the model each segment’s projected turnout rate is its observed participation rate from the 2020 general election.
The model was developed using data on historical participation rates are obtained from the Pennsylvania Department of State’s Full Voter Export (FVE) file as of August 12, 2024.1 Specifically, the calculated turnout frequencies are those observed for the subpopulation of the full FVE sample whose presence predates (whose registration dates are prior to) the registration deadline for the 2020 general election. 2
As with any projection model based on extrapolation from historical experience, realized outcomes may diverge from projections. In our context, the realized participation rate within a given voter history segment may diverge from the outcome projected by the model.
For instance, realized outcomes may diverge because of how voters react to the particular candidates or issues specific to each election cycle. Also, the composition of the voter population may change over time in ways that affect the segment participation rate. In the latter case, changes in size or demographic composition of the segment population might be observable, but the effects of these on participation rates may not be foreseeable.
That said, there are good reasons to expect projections to be reasonably accurate, especially in regard to rank ordering of participation likelihoods across voter history segments. Voters who have tended to vote sporadically in the past typically will continue to do so. Those who rarely have missed voting in an election almost surely will vote in the next one. Inactive voters have been classified as such by election officials for a substantive reason (such as failure to respond to an address verification notice), so that inactive status should correlate with relatively low likelihood of voting in the next election.
Performance analysis results by party affiliation
Projected outcomes for our assessment of model performance are obtained from applying the model to the population of registered voters in the FVE file as of October 21 (the registration deadline for the November election.) Realized outcomes–whether and how each registered voter cast a ballot in the election–are obtained from the January 20, 2025 FVE file.3
Table 1 shows the gap between projected and actual turnout in 2024 by party affiliation: turnout rate differentials in panel A and projected versus actual counts of voters in panel B. The Democrats achieved a turnout rate 1.5 percentage points higher than predicted (79.4 versus 77.9 percent), with actual turnout exceeding projected by about 56,000 voters. The Republican turnout rate (85.7 percent) was almost identical to predicted.
Although this might seem to be a small differential, in a closely contested battleground state like Pennsylvania even small turnout differences might swing an election one way or the other. In this case, the end result was that the Republican vote count in 2024 exceeded the Democrat count by about 52,000 instead of the projected 111,000 voters.
Table 1: Prediction error by party affiliation
Turnout percentage
| Party | actual | projected | gap |
| Democratic | 0.794 | 0.779 | 0.015 |
| Republican | 0.857 | 0.858 | -0.001 |
| Other | 0.678 | 0.694 | -0.014 |
Turnout count
| Party | actual | projected | gap |
| Democratic | 3,004,427 | 2,948,447 | 55,980 |
| Republican | 3,056,493 | 3,059,585 | (21,211) |
| Other | 925,607 | 946,908 | (3,092) |
Source: January 20, 2025 PA FVE file; Pennsylvania Voter Turnout Model
What factors lay behind the higher-than-predicted turnout of Democrat registered voters in 2024? One plausible explanation derives from the fact that between November 2020 and November 2024, the Democrats experienced a net loss of about 230,000 party-affiliated registered voters.
It is conceivable that these exiting voters had been less inclined to vote in 2020 compared to others within the same segment—a conjecture consistent with these voters’ apparent dissatisfaction with the party. With their departure, the party’s overall turnout rate would then rise.
It also is possible that some of the lift to Democratic turnout came from crossover voters—disaffected Democrats who had low turnout in prior elections but opted to vote for Trump in 2024 (while not changing their affiliation.) This conjecture is consistent with reported findings from national polls showing increased support for Trump within certain demographic segments of Democrat voters in 2024, such as younger men.
Also in Table 1, we see that turnout was lower than predicted among unaffiliated voters. The realized turnout rate for this cohort was 63.2 percent, lower than their predicted 65.4 percent, with actual turnout falling short by about 45,000 voters.
Reportedly, many voters from across the political spectrum in 2024 viewed both Harris and Trump as significantly flawed candidates. This view may have been particularly strong among independent voters and those not affiliated with either of the two major parties, providing a potential explanation for the relatively low turnout among these voters.
Drilling down further
While, the accuracy of projected turnout rates by party affiliation in an upcoming election is of foremost interest, having direct implications for the election outcome, accuracy within distinct voter segments is also of interest. Segment-level analysis may suggest ways to improve overall accuracy of the model. It also provides insight into robustness of the model–how accurate its projections would be if the composition of the population were to shift.
The model’s projections proved highly accurate for the segment consisting of voters who turned out for the primary preceding the general election. As shown in Table 2, the gap between actual and projected turnout rate for these voters is no greater than 6-tenths of a percentage point in each party affiliation category.
Table 2: Model performance for the segment of primary voters
| Party | actual | projected | gap |
| Democrat | 0.985 | 0.979 | 0.006 |
| Republican | 0.985 | 0.983 | 0.002 |
| Other | 0.949 | 0.953 | -0.004 |
Also noteworthy, but for a different reason, is the model’s performance within the inactive voter segment (exclusive of primary participants). Here, a substantially lesser degree of accuracy is observed. As shown in Table 3, actual exceed projected turnout rate for these voters by multiple percentage points in each party affiliation category.
Table 3: Model performance for the segment of inactive, primary non-participants
| Party | actual | projected | gap |
| Democrat | 0.432 | 0.37 | 0.062 |
| Republican | 0.515 | 0.395 | 0.12 |
| Other | 0.378 | 0.337 | 0.041 |
Because these prediction gaps are positive and large, they have a material influence on model performance within the subpopulation comprising non-participants in the primary. This is seen in Chart 1, which shows the prediction gaps for that population overall and by active versus inactive, by party affiliation. (Percentage point gaps are shown in panel A and count gaps in panel B.)
Chart 1: Actual minus predicted turnout rate by party affiliation and active versus inactive status
Turnout percentage
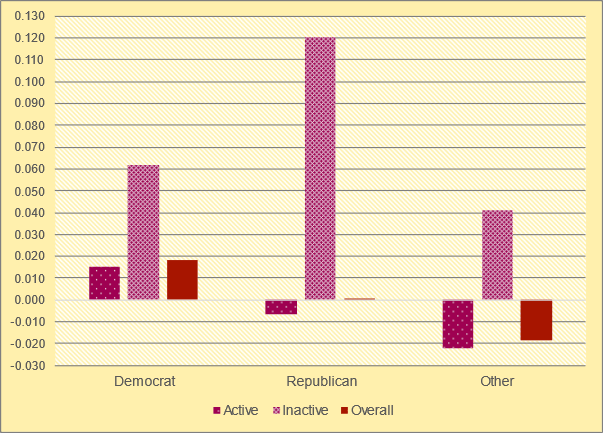
Vote count
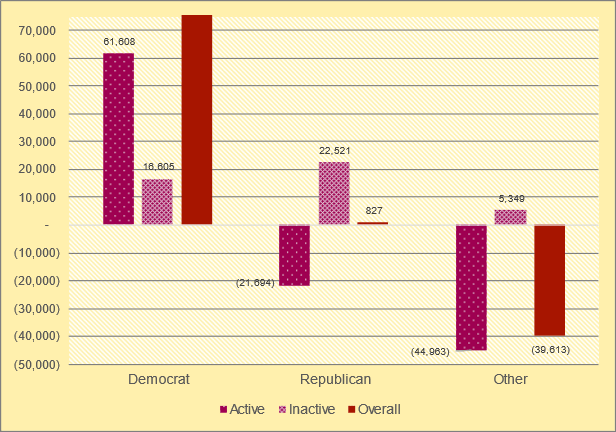
These results suggest that after 2020, the inactive voter classification process became less precise at distinguishing voters who had exited the Pennsylvania voting population (among those who had not participated in the primary.) Accordingly, in 2024 relative to 2020 there would have been more “false positives” (willing and able to vote) within the inactive segment. Conversely, there would have been more “false negatives” (unable or unwilling to vote) among those classified as active.
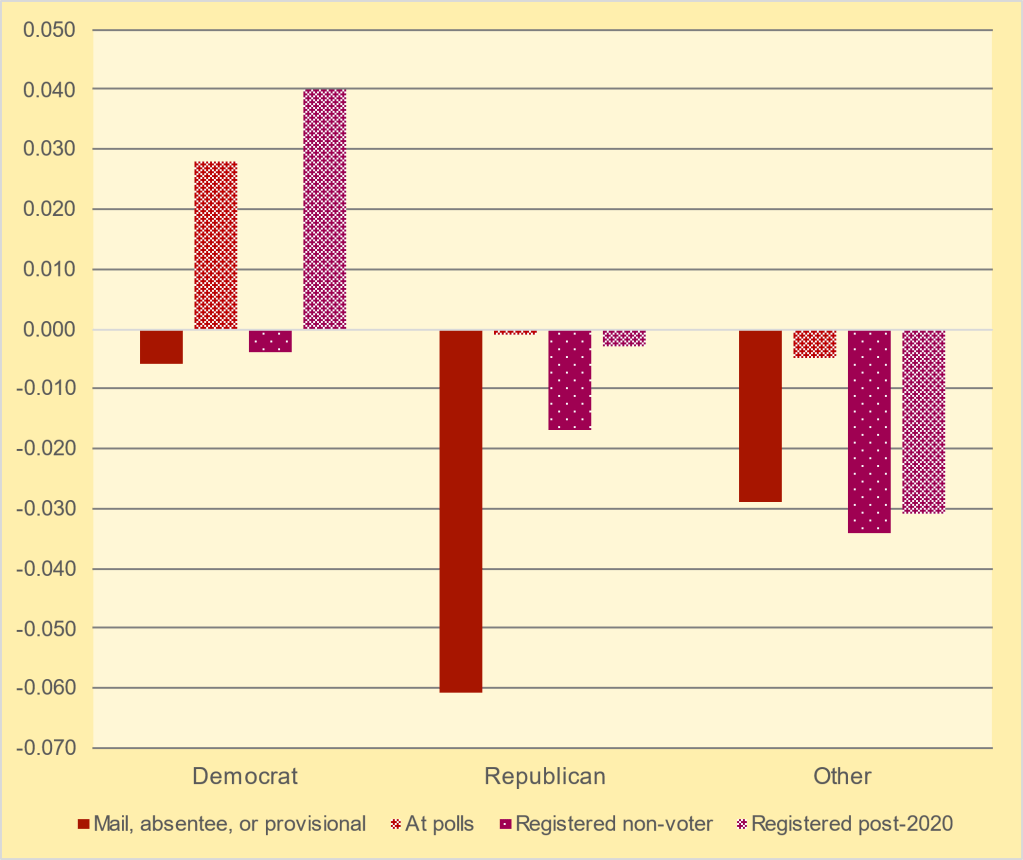
Let us now drill down yet further within the cohort of active, primary non-participants in 2024, distinguishing between those who voted by mail-in, absentee or provisional ballot in 2020 and others. Within this cohort, those who had voted by mail-in, absentee, or provisional ballot in 2020 had weaker 2024 turnout than those who had voted at the polls in 2020, relative to what the model had projected. This was the case within each party affiliation category, as shown in Chart 2.
Specifically, among Democrats, actual 2024 turnout exceeded projected by nearly 3 percentage points for those who had voted at the polls in 2020, while actual was 6-tenths of a percentage point below projected for the mail, absentee or provisional cohort. Among Republicans, actual 2024 turnout was about equal to projected for those who had voted at the polls in 2020, while actual was a full 6 percentage points below projected for the mail, absentee or provisional cohort. The latter cohort also underperformed relative to the at-polls cohort among voters in the “other” party affiliation category.
Chart 2 similarly shows that active, primary non-participants in 2024 who had been registered but did not vote in 2020 had weaker 2024 turnout than those voting at the polls in 2020, relative to what the model had projected. Again, this was the case within each party affiliation category.
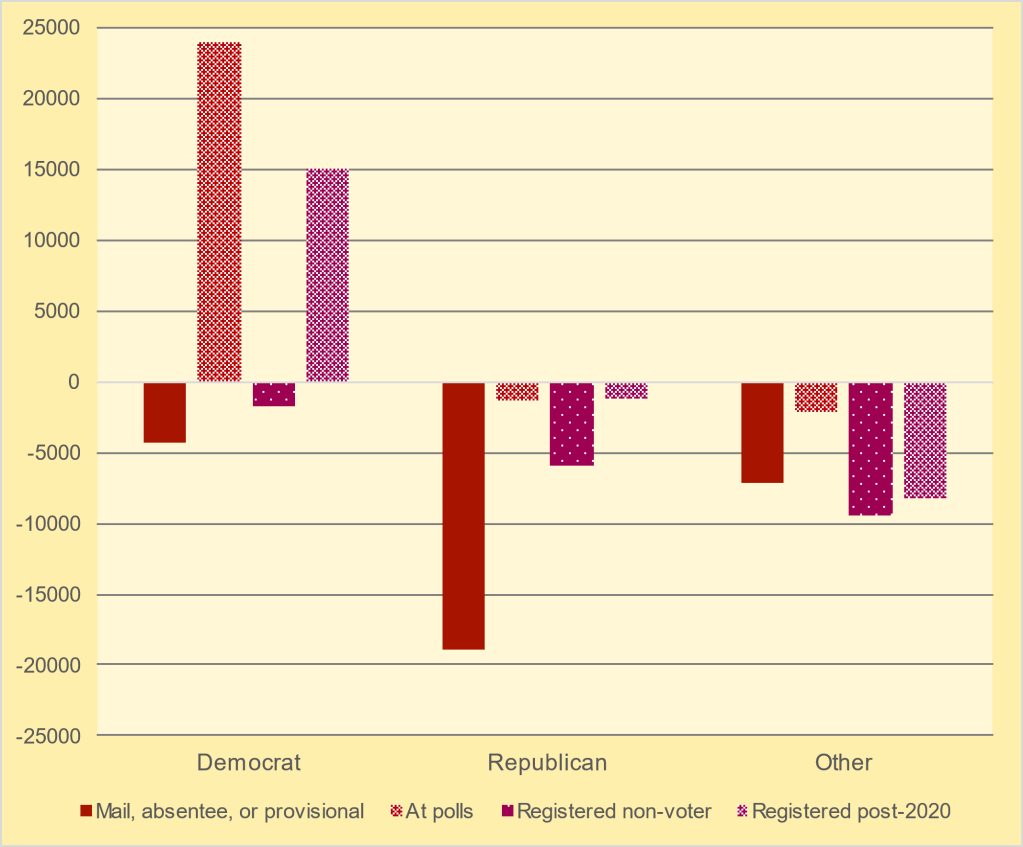
Chart 2: Prediction error by party affiliation and 2020 method of voting
(cohort of active, non-primary participants in 2024)
Turnout percentage
Vote count
Interpretive discussion
The factor or factors underlying the unexpectedly high turnout of inactive voters are not directly observable. As noted previously, their higher turnout suggests that being labelled inactive had become a less precise indicator of exit from the state’s voting population. But why might this be the case?
One plausible scenario is that the state has had less success after 2020 at identifying, and classifying as either ineligible or inactive, individuals who had relocated to other states. Hence, assignment of voters to inactive status became more idiosyncratic (such as due to voters relocating within the state and failing to update their registration data) and thus less reflective of actual exit from the voting population.
Consistent with this scenario is the fact that in early 2023, Florida, Ohio, Virginia, and West Virginia each pulled out of the cross-state data cooperative known as the Electronic Registration Information Center (ERIC).4 States that participate in ERIC share their voter registration data and receive notification about voters who appear to have relocated to other states. Each of these states that exited ERIC is a relatively common destination for voters relocating from Pennsylvania. Their departure could have impaired Pennsylvania’s efforts to maintain the accuracy of its voter registration database, including by labelling potentially relocated voters as inactive.
No-excuse mail-in ballots, first introduced in Pennsylvania for the 2020 election, may have further compromised the state’s ability post-2020 to identify voters who had moved out-of-state. No-excuse mail-in voting may encourage or facilitate cross-state voting, a phenomenon examined in a 2024 study from the National Bureau of Economic Research.5 Cross-state voting by relocated voters via mail-in ballot could preempt their being assigned to the inactive list or being removed from the registration rolls.
This line of reasoning suggests that the state’s ability to identify inactive or exited voters might have been undermined primarily among the population voting by mail during 2020. Thus, this reasoning is consistent with the finding that in 2024, active primary non-participants who had voted by mail in 2020 had substantially lower turnout rates than those who had voted at the polls in 2020, relative to the model’s projections.6
The preceding scenarios are clearly plausible. Confirmation of their explanatory relevance, however, requires gathering more direct evidence.
Stability of the Rank Ordering
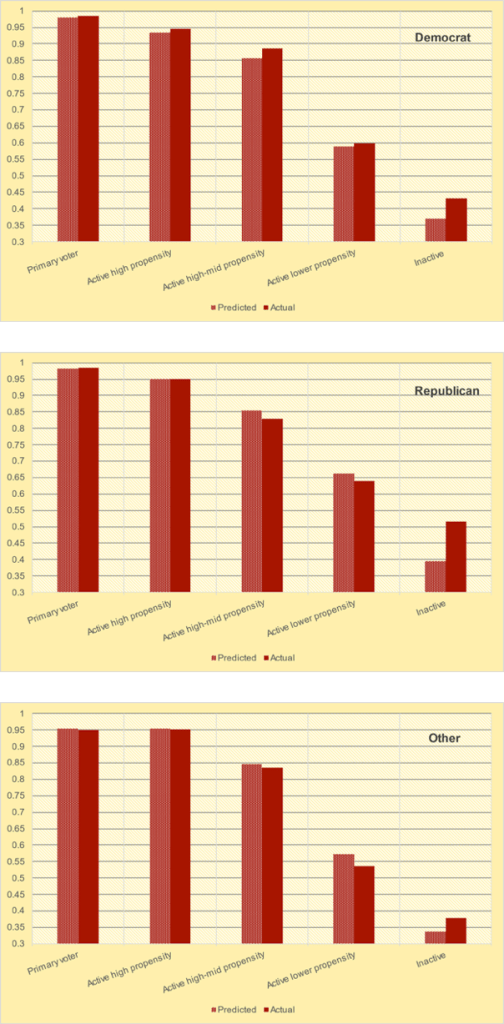
Although, there are aspects of divergence between actual and modelled turnout rates, as described above, the model reliably differentiates turnout likelihood across voter turnout segments. This is evidenced by stability of the rank ordering of turnout rates across modelled segments by party affiliation, as seen in Chart 3.
The five pairs of bars in Chart 3 depict projected and actual turnout rates for five turnout likelihood segments of voters. The first segment from the left comprises primary participants. The next three segments classify non-participants in the primary who are active into three ranges of projected turnout likelihood: high (90 percent or greater turnout likelihood); high-mid (at least 80 but less than 90 percent); and lower (below 80 percent). The last segment comprises inactive voters.
Both projected and actual turnout rates decline across segments moving from left to right in the chart. In most cases, the changes in actual and projected turnout rates closely align across adjacent segments, demonstrating stability and reliability of the model’s rank ordering of turnout likelihoods.
For each party affiliation, the largest misalignment occurs between the lower propensity range of active voters and the inactive segment. Here, the model’s projected decline in turnout rate overstates the actual decline, consistent with the earlier discussion on model accuracy.
For Democrats and Republicans, the next largest divergence occurs between the high and high-mid propensity ranges of active voters. Here, the model’s projected decline modestly overstates the actual decline for Democrats and understates it for Republicans. For the Other affiliation category, the second largest divergence occurs between the high-mid and lower propensity ranges, where the model understates the actual decline in turnout rate.
Chart 3- Stability of rank ordering by model turnout propensity
Concluding Summary
Projected voter turnout rates by party affiliation from the Pennsylvania Voter Turnout Model were close to actual. For Democrats, the actual turnout rate exceeded projected by 1.5 percentage points, while for Republicans, actual and projected were virtually equal. The model’s understatement of Democrat turnout conceivably might be tied to an exodus of less engaged voters from the Democratic party after 2020.
The model also reliably differentiates turnout likelihood across turnout propensity segments. While the model exhibits a high degree of accuracy, one should bear in mind that even small deviations in turnout can swing an election one way or the other in a closely contested state like Pennsylvania.
The model appears to be least accurate at projecting turnout rates of inactive, primary non-participants. This outcome suggests that Pennsylvania has had less success since 2020 at identifying and classifying as inactive, individuals who had relocated to other states.
One factor that may have impeded the state’s ability to identify these voters is the departure from ERIC in early 2023 of Florida and a few other states that Pennsylvanians commonly relocate to. No-excuse mail-in ballots, first introduced in Pennsylvania for the 2020 election, may have further hindered the state’s ability to identify voters who had moved out-of-state.
- The FVE data can be accessed here . ↩︎
- Thus, the estimation sample comprises only voters who were present in 2020 and have survived through 2024. We are unable to estimate a model using the full population that was present in 2020 because we lack access to archived FVE data from 2020. ↩︎
- The FVE data distinguishes between four methods of voting: at polls (in -person machine voting), provisional ballot, mail-ballot (no excuse mail-in), and absentee ballot (including military and other traditional absentee ballots). A missing value indicates non-participation. ↩︎
- See Miles Park, “Republican States Swore Off a Voting Tool. Now They’re Scrambling to Recreate It.” NPR.org, October 20, 2023. (Link) ↩︎
- See Gordon B. Dahl, Joseph Engelberg, Runjing Lu, and William Mullins, “Cross-State Strategic Voting.” National Bureau of Economic Research, Working Paper 30972, September 2024. (Link) ↩︎
- Similarly, the departures from ERIC may have curtailed the state’s ability to identify inactive or exited voters among the cohort who were registered but did not vote in 2020. As noted, this cohort had weaker 2024 turnout than those voting at the polls in 2020. Alternatively, this cohort may simply have become even less engaged as of 2024 than they were in 2020. ↩︎
