
This blog post examines changes in voter registration counts by party affiliation between October 21, 2005 and March 9, 2026 in Pennsylvania, supplementing the analysis with interpretive commentary. Data for the analysis are drawn from the state’s Full Voter Export (FVE) files as of these dates, downloaded from the PA Department of State website. Voter registration counts by observation date, party affiliation (Democrat, Republican, or Unaffiliated with either of the two major parties), and registration status (Active, Inactive) are shown in Table 1.
The Republicans’ strong showing in the 2024 Presidential Election apparently produced a momentum that brought forth further gains, as the party’s ranks of active voters subsequently grew by nearly 35,000 (a 1 percent increase) over this period. Conversely, the Democrat’s appeal to Pennsylvania voters seems to be eroding, with their active voter count dropping by more than 50,000 (a 1.4 percent decline) during this time. Given that Senator Dave McCormick was elected in 2024 by a mere 15,115 vote margin, this Republican net gain is significant.
However, the steepest increase in active voter count during this time occurred in the unaffiliated category—73,000 added (a 5.8 percent gain). Thus, it appears that Pennsylvania voters increasingly are choosing to locate in the independent middle.
Net exit of inactive voters ranged from 25 to 30 percent across the three party-affiliation groups. Republicans had the highest rate of exit of inactive voters, but since Democrats had many more to begin with compared to either Republicans or Unaffiliated, they saw the largest decline in number.
Components of the changes in active voter count. The change in number of active voters within a party affiliation category can be disaggregated into three constituent parts: the net number of new registered voters; net migration across party lines; and net transition from active to inactive within an affiliation category. Figure 1, panels A through C summarize this analysis for the three affiliation categories, respectively.
The two major parties experienced the same, 1.6 percent rate of registering new active voters. They lagged far behind Unaffiliated, which welcomed new voters at 5 times that rate, this being the primary reason why this group gained ground relative to Democrats and Republicans.
Net migration out of the Democratic party added another 11,000 or so active voters into Unaffiliated, only marginally offset by a net 1,750 voters who switched from Unaffiliated to Republican. This outcome suggests that the ideological stances or policy actions (or both) of the Democratic Party weakened their standing with Pennsylvania voters and lead to some fraying at the margins, whereas the Republican Party thus far experienced no such weakening. We see additional evidence of Democrats losing ground to Republicans in the observed, net migration to active Republican of more than 18,000 former (active or inactive) Democrats.
Each party affiliation category experienced substantial within-group net migration from active to inactive, reflecting the fact that active voters are more likely to become inactive than the reverse. The highest rate of attrition from active to inactive is seen for the Unaffiliated category (3.1 percent), which plausibly can be attributed to voters in this category being less politically engaged or motivated. Democrats have a significantly higher rate of attrition from active to inactive compared to Republicans (2.4 versus 1.3 percent). This again suggests eroding appeal of the Democrat brand (although it also could reflect underlying demographic factors.)
Components of the changes in inactive voter count. The change in number of inactive voters within a party affiliation category is almost entirely attributable to exit from the pool of registered voters partly offset by net, within-group transition from active to inactive. Table 2 presents this decomposition.
Within each group, close to half of the inactive voters present just prior to the 2024 Presidential Election had exited by March 9, 2026. Republicans experienced the highest rate of exit (49 percent) and lowest percentage inflow from active (19 percent), but only by small margins. As noted previously, Democrats experienced the largest numerical decline, being that they had many more inactive voters to being with.
Party affiliation of new voters by demographic segment. It may be of particular interest to take a closer look at the party affiliations of new voters, the largest single component of change in the number of voters (prior to netting out voter exits) in each affiliation category. Here, we examine how the party affiliation of new voters varies in relation to voter age segment and gender, characteristics recorded in the FVE database.
Table 3 quantifies new voters by party affiliation, both the numerical total and as a percentage relative to the initial count of active voters. Democrats have a marginally higher rate of entry compared to Republicans, while Unaffiliated exhibit more than double the rate of entry of Democrats. A majority of new voter registrations are associated with persons under age 35, as shown in Figure 2, panel A. New voters are close to evenly divided among male, female, and gender unknown, as shown in panel B.
A key distinction between the two age segments is the share of new Republican versus new Democrat voters as shown in Figure 3, which displays the ratio of Republican to Democrat along with the ratio of Unaffiliated to Democrat by age segment. Within the under-35 segment, Democrats outnumber Republicans by about 5:4, whereas in the older age segment, Republicans more slightly outnumber Democrats. Within each segment, there are close to 3 Unaffiliated voters per every 4 Democrats.
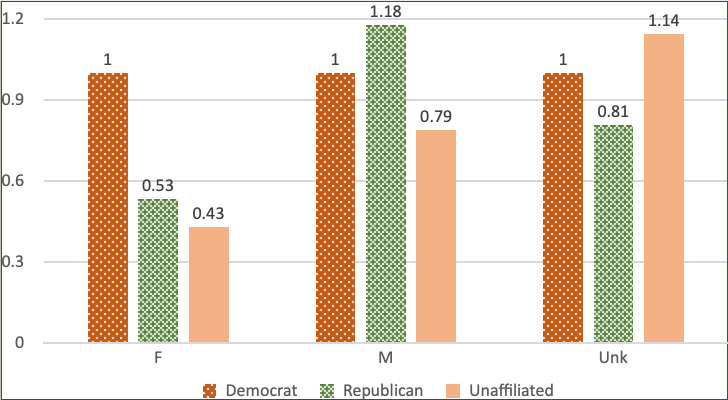
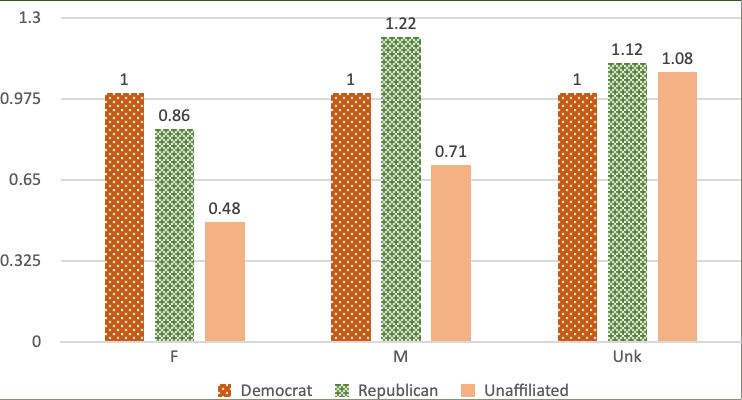
Figure 4 provides a further breakdown of new voters by their reported gender. Specifically, Figure 4, displays the ratio of Republican to Democrat along with the ratio of Unaffiliated to Democrat by gender (male, female, or unknown), in panel A for the under-35 age segment, and in panel B for the 35-or-older segment.
The under-35 segment is characterized by a striking correlation between party affiliation and gender. Among females in this age group, for each Republican new voter there are two new Democrats. Among males in this age group, Republicans outnumber Democrats, but only by a 6:5 ratio.
There is also some correlation between party affiliation and gender within the 35-or-older segment. However, it is less dramatic compared to the younger segment: Democrats only marginally outnumber Republicans among females, while roughly the same, 6:5 Republican-to-Democrat ratio holds among males.
Within both age segments, male voters are more likely to be Unaffiliated than are female voters. We also observe a strong correlation between being Unaffiliated and having unknown gender, suggesting that voters who value political independence also value maintaining privacy around the characteristics of their identity.
Table 1: Changes in Voter Registration Counts by Party Affiliation and Registration Status
| 21-Oct-24 | 9-Mar-26 | change | % change | ||
| Active | Democrat | 3,582,151 | 3,530,966 | -51,185 | -1.4% |
| Republican | 3,450,668 | 3,485,408 | 34,740 | 1.0% | |
| Unaffiliated | 1,263,038 | 1,336,016 | 72,978 | 5.8% | |
| Inactive | Democrat | 388,325 | 286,114 | -102,211 | -26.3% |
| Republican | 221,351 | 154,770 | -66,581 | -30.1% | |
| Unaffiliated | 179,697 | 135,054 | -44,643 | -24.8% | |
| Total | Democrat | 3,970,476 | 3,817,080 | -153,396 | -3.9% |
| Republican | 3,672,019 | 3,640,178 | -31,841 | -0.9% | |
| Unaffiliated | 1,442,735 | 1,471,070 | 28,335 | 2.0% |
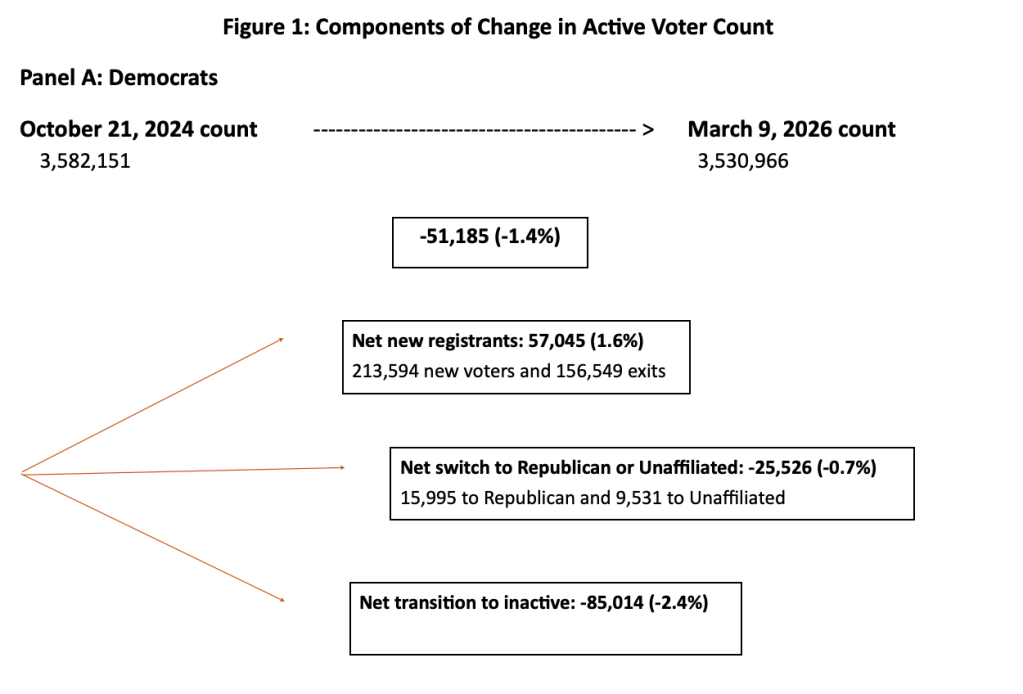
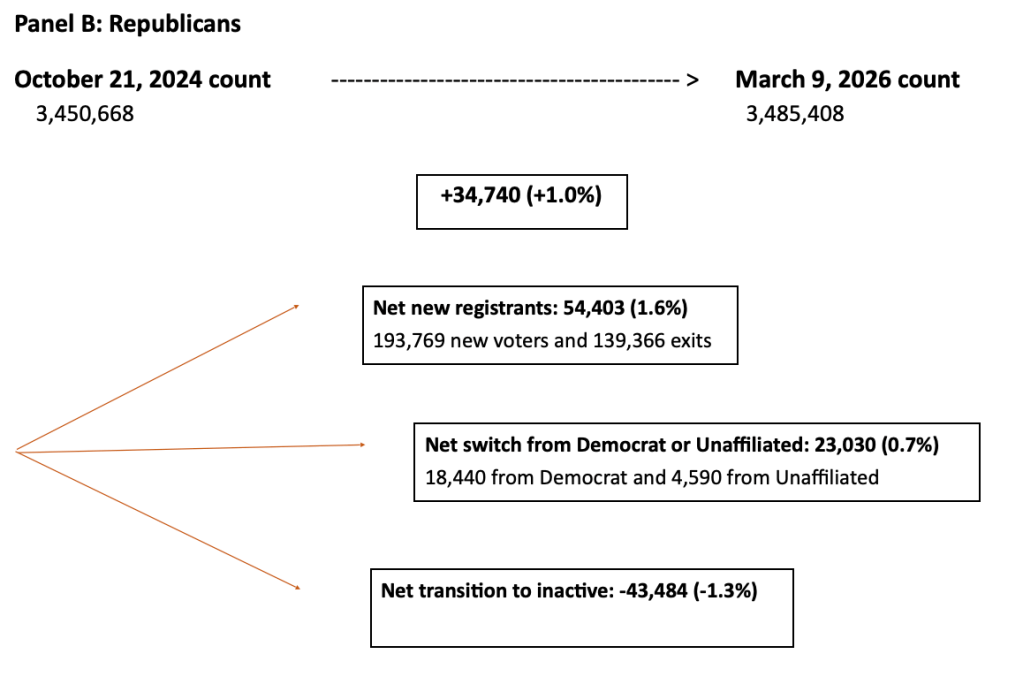
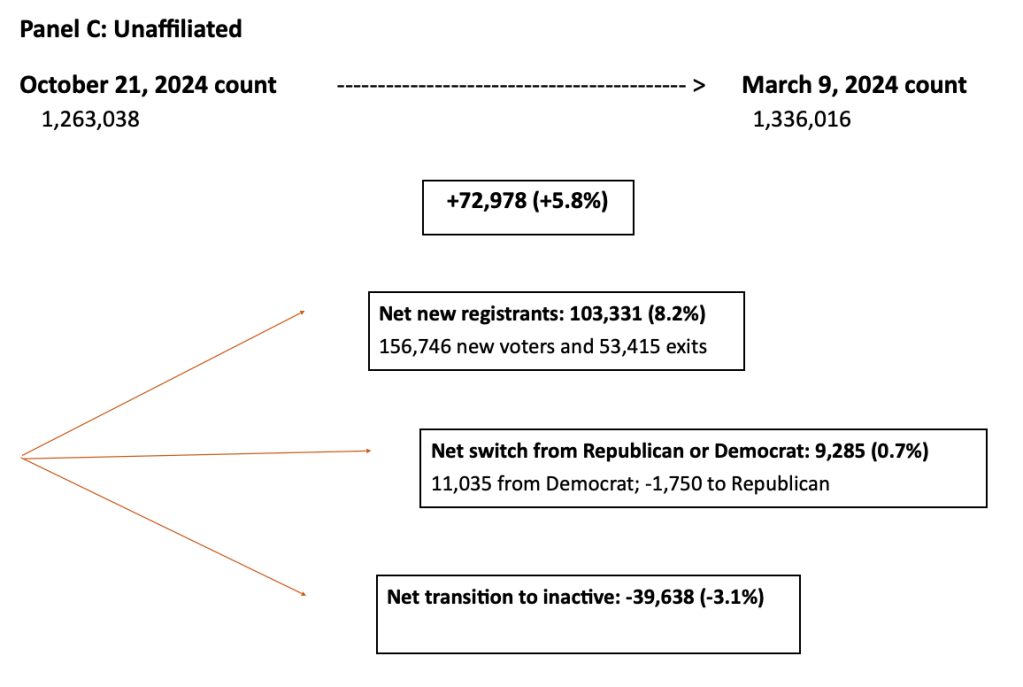
Table 2: Components of Change in Inactive Voter Counts
| 21-Oct-24 | Net Exit | % Net Exit | Net within-group migration | % Net in- migration | 9-Mar-26 | Change | % Change | |
| Democrat | 388,325 | -181,789 | -46.8% | 79,578 | 20.5% | 286,114 | -102,211 | -26.3% |
| Republican | 221,351 | -108,425 | -49.0% | 41,844 | 18.9% | 154,770 | -66,581 | -30.1% |
| Unaffiliated | 179,697 | -81,467 | -45.3% | 36,824 | 20.5% | 135,054 | -44,643 | -24.8% |
Table 3: Number of New Voters by Party Affiliation
| Affiliation | Count | Ratio: New to 2024 Active |
| Democrat | 220,483 | 6.2% |
| Republican | 198,261 | 5.7% |
| Unaffiliated | 161,527 | 12.8% |
Figure 2: Number of New Voters by Demographic Segment
Panel A: by Age Segment Panel B: by Gender
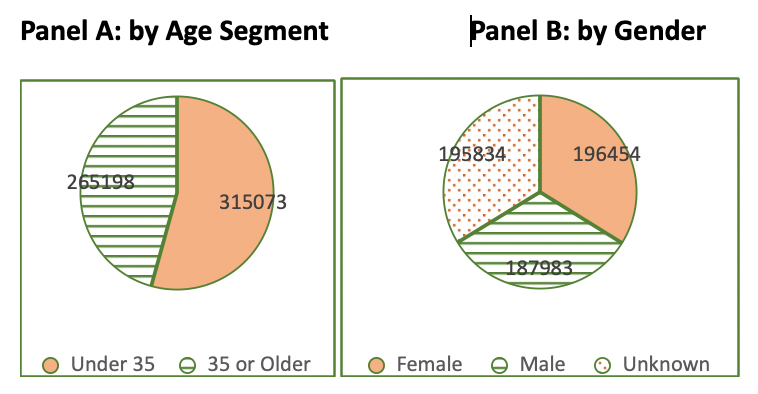
Figure 3: Frequency of Republican or Unaffiliated Relative to Democrat among New Voters, by Age Segment
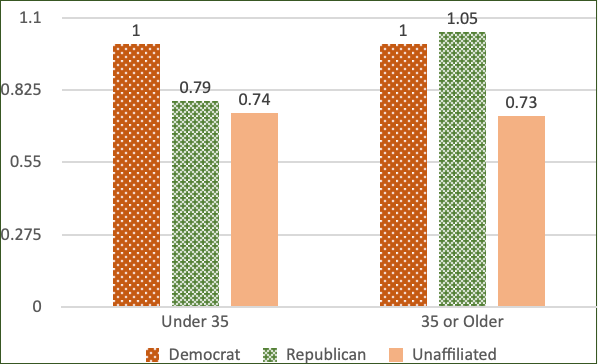
Figure 4: Frequency of Republican or Unaffiliated Relative to Democrat among New Voters, by Age Segment and Gender
Panel A: Age Under 35
Panel B: 35 or Older

Leave a comment