
In the 2020 Presidential Election in Pennsylvania, Joe Biden prevailed by about 80,000 votes over Donald Trump. In 2024, against Kamala Harris, Trump prevailed by about 120,000 votes, thus gaining about 200,000 votes on net.
Might the 2024 outcome signify a fundamental shift in Pennsylvania’s political landscape? This note delves into this question from a data-driven perspective.
Inferences from registration and participation data
Two key factors indicate that at least a part of the Republican gains in 2024 are more than just fleeting and will be challenging for the Democrats to turn back.
First, between November 2020 and November 2024, the number of voters registered as Democrats declined substantially, while the counts of registered Republicans and of those unaffiliated with either major party increased, as seen in chart 1. Moreover, those increases were a continuation of gains accrued between 2016 and 2020 by those groups.
Chart 1: Pennsylvania registered voter counts by party affiliation

Source: PA Department of State 2016, 2020, and 2024 Voter Registration Statistics
Going into the November 2020 election, the Democrats had enjoyed an advantage of 686,000 more registered voters compared to the Republicans (rounding to the nearest 1,000). Because of each party’s gains and losses over the interim period, as of November 2024, the Democrats’ registered voter advantage had fallen to 286,000.
Second, based on extrapolation from 2020 turnout rates (using statistically modeled turnout likelihoods), the Republicans had a substantial turnout rate advantage over the Democrats going into the November 2024 election.1 Democrat registered voters had an expected turnout rate of 77.9 percent, compared to 85.8 percent for the Republicans and 69.4 percent for unaffiliated and other voters.
Consequently, the Democrats’ shrinking margin in raw number of registered voters enabled the Republicans in 2024 to surpass the Democrats in participation-weighted count—the number of voters expected to participate in the November 2024 election. As shown in chart 2, the expected count of participating Republican voters, based on modeled turnout likelihoods, exceeded that of the Democrats by about 110,000, presaging a Republican victory.
Chart 2: Predicted (turnout-weighted) 2024 counts by party affiliation
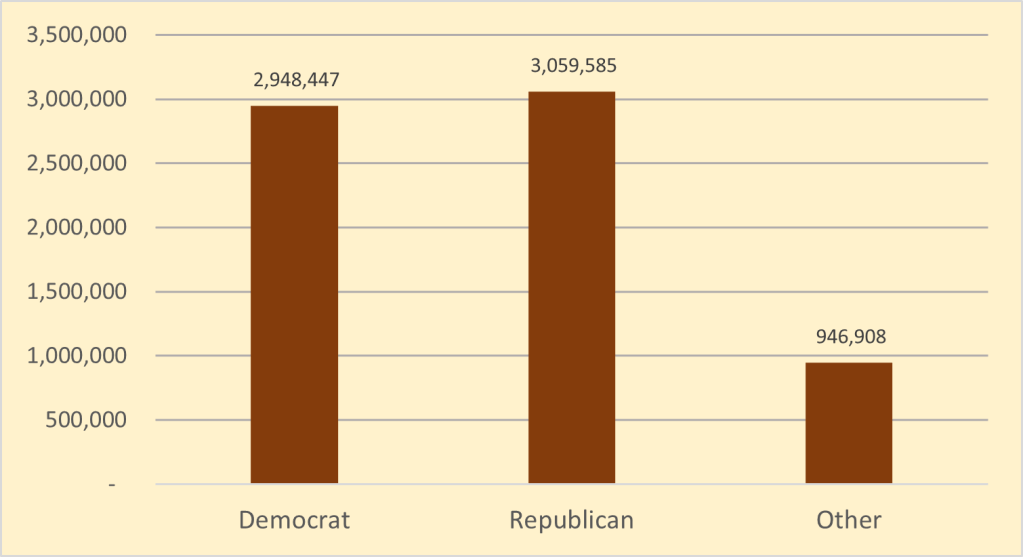
Source: Unrivaled Politics data turnout model, from PA voter registry
Democrat turnout in 2024 ended up higher than expected
Model-based predictions, of course, are subject to error. Chart 3 shows the gap between predicted and actual turnout in 2024 by party affiliation: the turnout rate differentials in panel A and predicted versus actual counts of voters in panel B.
The Democrats achieved a turnout rate of 79.4 percent, higher than the predicted 77.9 percent, with actual turnout exceeding predicted by about 56,000 voters. The Republican turnout rate (85.7 percent) was almost identical to predicted. The end result was that the Republican vote count exceeded the Democrat count by about 50,000 (instead of the predicted 110,000).
What factors lay behind the higher-than-expected turnout of Democrat registered voters in 2024? One plausible explanation is a “selection effect” from voters who had left the Democratic Party (by switching to unaffiliated or Republican) between 2020 and 2024. It is conceivable that these exiting voters had had been less inclined to vote in 2020 compared to others within the same segment—a conjecture consistent with these voters’ apparent dissatisfaction with the party. With their departure the party’s overall turnout rate would rise.
It is also conceivable that the lift to turnout came from disaffected Democrats who had low turnout in prior elections but opted to cross-party lines and vote for Trump in 2024, without changing their affiliation. This conjecture is consistent with reported findings from national polls showing increased support for Trump within certain demographic segments of Democrat voters in 2024, such as younger men.
Chart 3: Prediction error by party affiliation
Chart A: Turnout Percentage Chart B: Vote Count
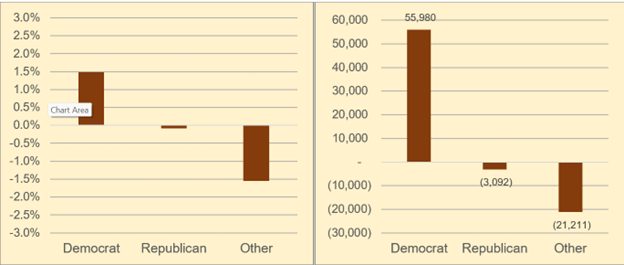
Source: Unrivaled turnout model (from PA voter registry)
Independent and cross-over voters necessarily account for the remaining margin
The analysis thus far has established that if voting had been strictly along party lines, with Trump and Harris tied among independent voters or those not affiliated with either major party, then Trump would have won by 50,000 votes. It then follows purely mathematically that the residual 70,000 vote portion of Trump’s winning margin must have come from getting more cross-over votes from Democrats than Harris received from Republicans, or from dominance among unaffiliated voters, or from some combination thereof.
In this sense, most of Trump’s margin appears to have come from swing voters, who tend to be less wedded to a partisan point of view and comparatively responsive to individual candidates and the candidates’ stands on key issues. Underscoring this point is the fact that in the Pennsylvania senatorial race, the Republican candidate Dave McCormick garnered only about 15,000 more votes than the incumbent, Democratic candidate Bob Casey Jr., mostly due to Trump voters who had opted not to support McCormick.2
On the role of mail-in voting in 2024
Reportedly, many voters from across the political spectrum in 2024 viewed both Harris and Trump as significantly flawed candidates. As was seen in Chart 3, turnout was lower than expected among unaffiliated voters, perhaps for that reason. However, Republicans did not have noticeably lower turnout, and Democrats had higher turnout relative to model predictions.
Potential explanations for Democrats’ higher-than-expected turnout have already been offered. But what might explain the sustained high turnout of Republican voters?
One possibility is that Republican voters who may have disliked Trump still voted for him because of concerns about what a Harris presidency might bring (in terms of a doubling down on Biden’s most divisive policies). Another is that the unrelenting, brutal lawfare and perceived weaponization of justice against Trump motivated Republican voters to circle the wagons, so to speak.
Another important factor to consider is stronger embrace of mail-in voting by the Republican party in 2024 relative to 2020. Mail-in voting can bolster participation by making the process more convenient for some voters and less susceptible to Election Day attrition. Thus, greater receptivity toward mail-in voting may have helped boost Republican turnout and offset lack of enthusiasm for Trump among some elements of the party.
During the 2020 election, the ongoing coronavirus pandemic spurred popularity of mail-in voting, due to perceived risks of social contact at polling places. However, the mail ballot option proved far more popular among Democrats in 2020 compared to Republicans. The latter held far less confidence in the security and reliability of mass mail-in voting, which had been newly introduced into Pennsylvania.3
This attitudinal gap between Democrats and Republicans in 2020 was evidenced by the fact that about 58 percent of the votes for Biden were by mail-in or absentee ballot, compared to just 18 percent of Trump votes. In 2024, however, this attitudinal gap had moderated, likely due in part to organized efforts, such as an initiative known as the “Pennsylvania Chase”, that promoted mail-in voting among Republicans.4
This change in attitude is demonstrated in Chart 4, which shows the ratio of Democrat to Republican mail-in ballot share (frequency of voting by mail-in ballot) across four segments of the 2024 participating voter population.5 The first bar from the left shows the ratio of mail-in ballot shares in 2020 for the subpopulation comprised of voters who participated in both the 2020 and 2024 elections. The second bar from the left shows the ratio of mail-in ballot shares in 2024 for the same subpopulation.
The third bar shows the ratio of Democrat to Republican mail-in ballot shares in 2024 for participants in 2024 who were present but did not vote in 2020. The final bar shows the ratio of Democrat to Republican mail-in ballot shares in 2024 for participants in 2024 who were not present in 2020.
Thus, in 2020 ,the frequency of mail-in voting by Democrats was 2.8 times that of Republicans among voters who participated in both elections. The ratio of Democrat to Republican mail-in voting frequency within this cohort declined to 1.7 in 2024. The other two cohorts had ratios in 2024 of 1.4 and 1.7, respectively.6
This analysis suggests that organized efforts to normalize mail-in voting among the Republican electorate had succeeded, whereby they became more receptive to the mail-in option than they had been in 2020. As noted, such increased openness toward mail-in voting could have bolstered turnout.
Chart 4: Ratio of Democrat to Republican mail-in ballot share by voter history segment
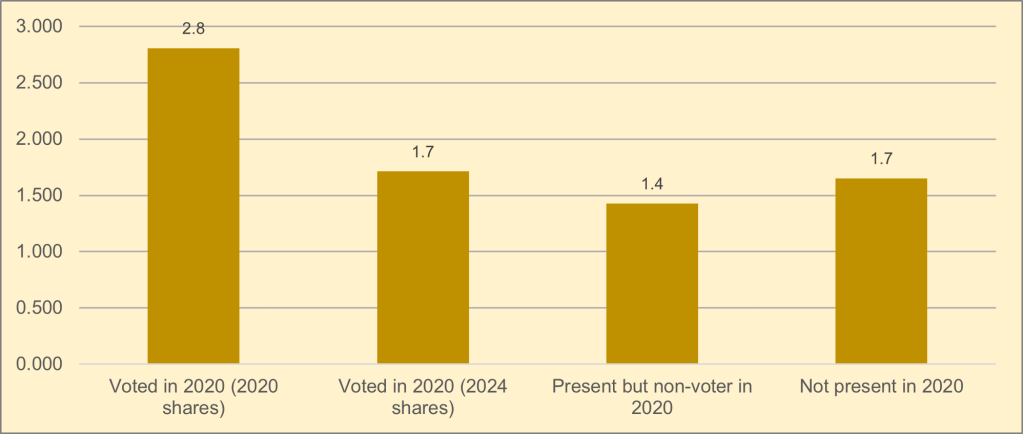
Source: Unrivaled voter turnout calculations using the PA Voter Export data file
Concluding summary
Since 2016, there has been a steady increase in the number and percentage of registered voters in Pennsylvania choosing to affiliate with the Republican party. The number and percentage of unaffiliated voters has also grown. There are roughly 220,000 fewer registered Democrats in the state today compared with 2020 (or with 2016).
The Democrats still enjoy a raw numerical advantage in Pennsylvania—the number of registered Democrats exceeds the count of registered Republicans by over 300,000 voters. However, the Republican share of the voter population has clearly been on a upward trajectory.
Moreover, the Republican Party in 2024 benefitted from a substantially higher turnout rate compared to Democrats. Their turnout rate advantage provided them with a slim, turnout-weighted margin, whereby they outvoted Democrats by about 50,000 votes cast. Efforts to make Republican voters more receptive to vote-by-mail plausibly helped bolster the party’s turnout in 2024.
In 2024, Trump prevailed over Harris by 120,000 votes, from which we can deduce that he netted some 70,000 votes from cross-over Democrats and independent voters. However, these should be considered swing voters who might readily reverse course in the next election.
The current, slim, turnout-weighted difference in number of Republican versus Democrat registered voters signifies that Pennsylvania remains a swing state—the decisions of cross-over and independent voters can still swing an election one way or other. Yet there is no question that the Republican Party today is much better positioned for winning in Pennsylvania compared to the recent past and appears to be on a trajectory to strengthen its position.
- An ex-ante probability of turnout is assigned to each registered voter in 2024 based on a statistical model fit to data from previous elections. These modeled turnout probabilities are then applied to obtain estimates of the number of participants in the November 2024 election, by party affiliation. ↩︎
- Their lack of support was reflected in their opting not to cast a vote or voting for a minor party candidate. ↩︎
- Before 2020, vote-by-mail was limited to traditional absentee ballots, which were available only to military and oversees civilian voters or those professing to have a valid reason for being away from their home precinct on election day. Beginning in 2020, no excuse was required to vote by mail, although voters could still opt for the traditional absentee ballot. The vast majority of voting by mail has relied on the new, no-excuse ballot format. ↩︎
- The PA Chase is an initiative of the of the Citizens Alliance of Pennsylvania. ↩︎
- Here, and through the discussion below, the term mail-in ballot includes both the traditional absentee and the newer, no-excuse vote-by-mail formats. ↩︎
- Mail-in voting might be most effective at increasing turnout rates among voters with lower turnout propensities. If voters with high modeled likelihood of participation (90 percent or higher) are excluded from this analysis, then these ratios become 2.1, 1.5, 1.3, and 1.6, respectively. ↩︎

Leave a comment