
Voting at a polling place or filling in and returning an absentee ballot can be regarded as the “demand side” of the voting process. Until 2020, elections in Pennsylvania, and in other states without a no-excuse mail-in voting option, primarily played out on the demand side.
Most voters had only one option, which was to go to the polls and pull the lever for their preferred candidate. Absentee voting was limited to active military, and to civilians specifying a pertinent reason they would be unable to go to their polling places on election day. Therefore, the process was controlled almost entirely by citizens’ decisions about whether to vote and for whom to vote.
However, the introduction of no-excuse mail-in voting in 2020 in Pennsylvania and other states greatly expanded the “supply side” of the election process. The added supply-side dimensions encompass the mechanics and procedures by which voters apply for mail-in ballots; how these applications are processed; and how the ballots are then distributed, returned, and tallied.
While in some states mail-in ballots are automatically distributed to all registered voters, in many states, including in Pennsylvania, voters must apply, either online or paper, to receive a mail-in ballot. Where this is the case, efforts to encourage and facilitate of mail-in ballot applications from voters, so-called “application harvesting”, can become a critical, “supply-side” activity affecting the outcome of the election.
This article analyzes data from the 2020 Presidential election in Pennsylvania, finding that spikes in paper applications for mail-in ballots from registered Democrats that occurred in the latter half of August into the first week of September may have produced enough votes to swing the election to Joe Biden. The analysis demonstrates the importance of the supply side to the outcome of the election, as the most plausible source of the spikes was application harvesting activity by partisan actors.
Forms of application harvesting
Nonprofit, tax-exempt, and technically non-partisan “get-out-the-vote” organizations as well as the political parties themselves historically have focused on promoting voter registration. With the expansion of mail-in voting, they have allocated increased attention and resources to application harvesting activities.
One important tactic the nonprofit organizations have employed is the mass distribution of paper applications for mail-in ballots. For example, it is well known that two nonprofit “sister” organizations, the Center for Voter Information and the Voter Participation Center, had together engaged in a massive effort to promote mail-in voting for the 2020 general election, by sending out millions of paper applications for mail-in ballots via postal mail to voters in multiple states.
But get-out-the-vote organizations are not the only possible conduit for application harvesting. Other organizations that are ostensibly nonpartisan such as employee associations, professional organizations, and the like, might distribute paper applications for mail-in ballots to their members.
While permissible in Pennsylvania and many other states, such organizations generally are required to conduct their activities in a non-partisan manner. Sixteen states currently restrict or prohibit third-party individuals or groups from distributing absentee and mail-in ballot applications, according to the National Conference of State Legislatures.
The political parties themselves may engage directly or through surrogates in application harvesting activities, including through mailbox stuffing, door-knocking campaigns, or personal, interactive outreach campaigns by party loyalists. Conceivably, personal outreach might be more effective than mass mailbox-stuffing.
For instance, party activists might be supplied with paper applications to personally distribute to family, friends, or neighbors who share their political leanings. The activists not only would seek to persuade these relatives, friends, and neighbors to apply for a mail-in ballot but could supply them with their own set of applications and encourage them to reach out to others in the same way. Such a campaign, if sufficiently scaled up, could be quite effective at generating additional votes.
Is application harvesting legit?
Application harvesting is a legitimate election-related activity provided it is conducted in accordance with established rules and norms. For instance, when engaged in by non-partisan not-for-profit organizations (where permissible by state law), it can lose legitimacy if conducted in a manner that excludes voters from a disfavored party or if coordinated with a favored party.
The legitimacy of application harvesting efforts by political parties or their surrogates could be open to question to the extent they might incorporate overly aggressive or intrusive tactics or violations of privacy. Indeed, it is conceivable that application harvesting activity in some cases might cross the line into questionable tactics.
For instance, an application might be filed by one individual on behalf of another, either directly without informing the prospective voter, or by asking him or her to sign a pre-filled form without adequate informed consent. A nursing home employee might instruct a resident to sign a ballot application that the employee had filled in, a clear violation of trust or fiduciary responsibility, for example.
A fundamental concern around mail-in voting in general is that the voter’s privacy could be compromised—persons voting by mail may be subject to intrusion into their decision-making, from the initial choice whether to vote by mail right up to the point that they seal their ballot. Such a concern encompasses application harvesting. For example, an intrusive family member might apply for a mail-in ballot on another’s behalf, a form of voter impersonation, as part of a scheme to pressure the voter.
Introducing the data
The source of the data for the analysis is a dataset from the Pennsylvania Department of State with detailed information on each approved application for an absentee or mail-in ballot for the 2020 General Election. A link to the dataset, which is housed within the Department’s online Open Data Portal, was shared with the author in response to a “Right-to-Know Law” (RTKL) request.
Individual data items include the date the application was received by the county in which the voter is registered. The data also indicate the means by which an application was submitted — either online, or as a paper application delivered by postal mail or in person at an election office.
In addition, the data distinguish between traditional absentee ballots available to voters and the newly available, no-excuse mail-in ballots (henceforth to be referred to simply as absentee and mail-in, respectively) and further differentiate among types of traditional absentee ballots, such as military, overseas civilian, regular civilian, and so on. The data also provides the voter’s date of birth and party affiliation.
Counts of applications according to the type of application filed indicate that more than 1.2 million paper and about 1.4 million online applications for the no-excuse mail-in ballots were submitted, far outnumbering requests for traditional absentee ballots. Online applications for domestic, civilian absentee ballots were the third largest category, totaling about 326,000.


Chart 1 shows the distribution of applications for mail-in ballots by type of application separately for three age ranges: under 35 (younger voters); over 70 (older voters); and 35 to 70 (mid-age voters). Younger voters favored online to paper applications by roughly a 2 to 1 margin, with the reverse being the case for older voters. Mid-age voters also favored applying online, but by a smaller, 35 percent margin.
Chart 2 shows counts of applications for no-excuse mail-in ballots by application type (online or paper) across five time periods defined as follows:
- Applications received prior to June 1 would mostly (perhaps entirely) have been from voters who had applied to vote by mail in the early June Primary and had opted (by checking a box on the Primary application) to automatically receive a mail-in ballot for the General Election. Thus, it is natural to distinguish this period, which we refer to as the Primary period.
- Ballot printing in Pennsylvania did not move forward until the state’s Supreme Court resolved a dispute over the Green Party candidates would appear on the ballot. That decision was announced on September 17, which we adopt as the end date of the second application period and shall refer to that as the “summer period”.
- The remainder of September constitutes the third period.
- The state’s deadline for applying for a mail-in ballot was October 27, motivating a division of October into two roughly equal-sized periods: the 1st through the 14th, and the remaining days up to the application deadline.
As seen in this chart, the number of online applications associated with the Primary period was about double the number of paper applications associated with that period. The number of online applications dropped off sharply between the Primary and summer periods, but there was just a small decline in the number of paper applications between these periods. Note that Primary period applicants were restricted to voters registered as Democrat or Republican, because in Pennsylvania voters must be affiliated with the party to vote in its primary, while later applicants additionally included those not affiliated with either of the two major parties.
A surprising divergence
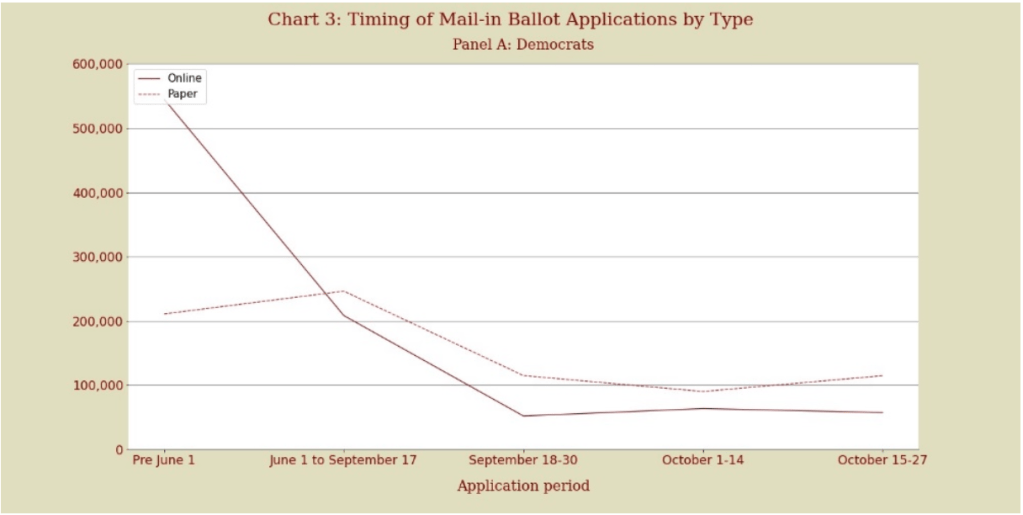
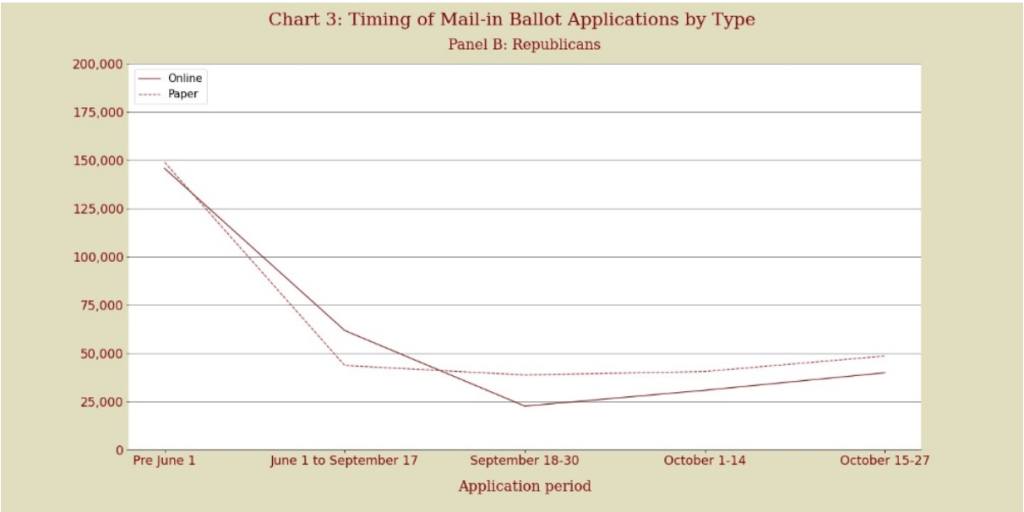
Chart 3 disaggregates Chart 2 based on party affiliation: the number of applications by period and type are shown in Panel A for Democrats and in Panel B for Republicans.
For the Primary period, online outnumbered paper applications by more than two-to-one among Democrats, whereas applications were about evenly divided between online and paper among Republicans. These differing shares of online versus paper might reflect socioeconomic and demographic differences by party affiliation among voters who participated in the Primary.
It also is evident from Chart 3 that online applications from voters of both parties as well as paper applications from Republicans dropped sharply between the Primary and summer periods. However, paper applications from Democrats increased between the two periods.
Thus, the path of paper applications from Democrats exhibits a remarkable divergence. It is now evident that the contrasting dynamics seen in Chart 2 for online versus paper applications reflect the divergent path of paper applications from Democrats.
Specifically, paper applications from Democrats rose by nearly 20 percent, whereas those from Republicans plummeted by 70 percent and online applications from both parties fell by about 60 percent. If paper applications from Democrats instead had dropped only half as much as online applications; that is, by 30 percent, Democrats would have had about 100,000 fewer mail-in ballot applications.
That would translate into 90,000 fewer votes (assuming a 10 percent non-return rate of mail-in ballots, which is the non-return rate observed in the data for summer period, paper applications from Democrats.) That number of votes would have been more than enough to swing the state’s Presidential election. In a sense, then, the 2020 election outcome was a done deal by summer’s end, determined by the summer period’s heavy volume of paper applications for mail-in ballots from Democrat voters.
It seems a safe bet that some form of organized campaign had put paper applications in the hands of registered Democrat voters during this time and then encouraged them to fill out and submit the applications. In other words, the divergent path of paper applications likely was a supply-side phenomenon, not a spontaneous wave of voter enthusiasm for Joe Biden. Otherwise, one would expect equally strong momentum for online applications from Democrats.
Drilling down further—weekly application dynamics
The Department of State data contain sufficient detail to support a more granular examination of the timing of mail-in ballot applications, including further exploration of the summer period surge in paper applications from Democrats. The data also provide the ability to drill down to the county level, enabling an analysis of weekly application rates by county. It is advisable to disaggregate this way because a state-level analysis might mask significant differences across individual counties.
The approach we pursue here is to track weekly application rates (measured as each week’s average daily count) by application type, county, and party affiliation, from the week ending June 7 through the week ending October 27. Because overall application volume can differ greatly across counties and between Democrats and Republicans in any given county, the approach involves normalizing the weekly application rate for each party in each county relative to a benchmark week, in order to facilitate visual comparisons of the timing of activity. The week ending September 20 is selected for this normalization.
The dynamics of paper applications
It turns out that counties can be segmented into groups based on visual comparison of weekly application rates for paper applications from Democrat voters, such that counties within the same group have similar dynamics that are distinct from those in other groups. All but one of these groups exhibit comparatively rapid acceleration in applications from Democrats during mid-to-late August, with a peak application rate occurring no later than the week before Labor Day. The primary distinction among the several groups exhibiting this characteristic pattern regards the timing of the peak—the week in which the paper application rate from Democrats reached its apex.
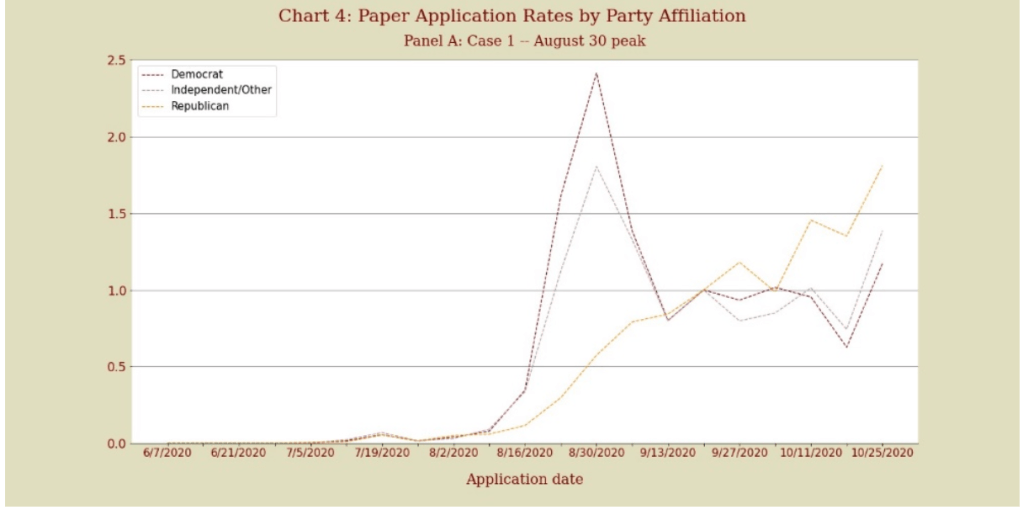
Thus, in these counties, which comprise most of the state, paper applications from Democrats are front-loaded relative to paper applications from Republicans. The largest of these groups, consisting of 19 counties, is characterized by a spike in the former that peaks in the week ending August 30, as shown in panel A of Chart 4.
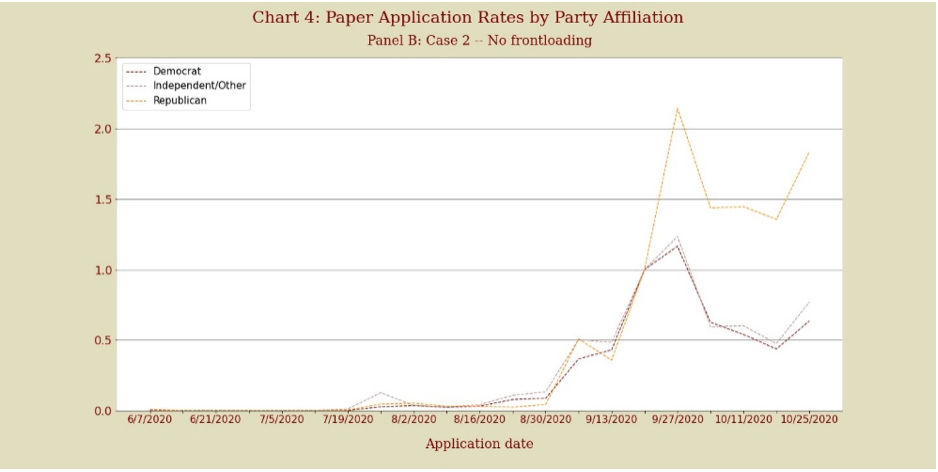
For the sake of brevity, we shall limit our discussion of application rate dynamics to the latter cohort (as broadly representative of all groups characterized by front-loading of paper applications from Democrats) and the single cohort not exhibiting this pattern; that is, no front-loading. The dynamics of paper applications for the 18 counties comprising the latter cohort are shown in Chart 4, panel B.
Map 1 distinguishes the latter cohort based on distinct, lighter green shading, and likewise differentiates the other counties by degrees of darker shading, according to the week in which the rate of paper applications from the county’s Democrat voters was at its apex. Due to data irregularities, three counties remain unclassified.

Panel A of chart 4 shows a surprisingly steep and voluminous surge in paper applications from Democrats within the last two weeks of August and into the first week of September in the group of counties represented. This compares to a more gradual and modest rise for Republicans. For voters unaffiliated with either of the two major parties (self-declared Independents and others), paper application rates were situated between those of Democrats and Republicans during the weeks of the spike. Thus, we find that the Democrats reaped a bountiful, late summer harvest of paper applications for mail-in ballots in these (and in most other) counties within this three-week period.
In stark contrast, as seen in Panel B, the no-frontloading group exhibits nearly identical dynamics between Democrats and Republicans for paper applications through the week ending September 20. In both cohorts, application rates from Republicans continued to rise after mid-September; those from Democrats did not. As a result, the paper applications from Republicans were comparatively back-loaded.
The dynamics of online applications
No such surge occurred in the case of online applications. In contrast to paper applications, the dynamics of online applications through the week ending September 20 were very similar between Democrats and Republicans, within both county groups, as seen in the two panels of Chart 5.
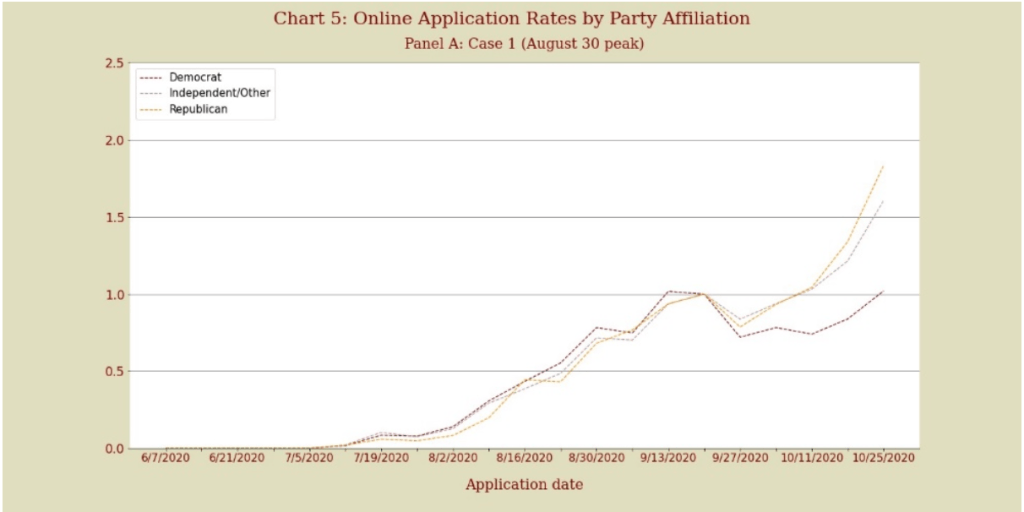
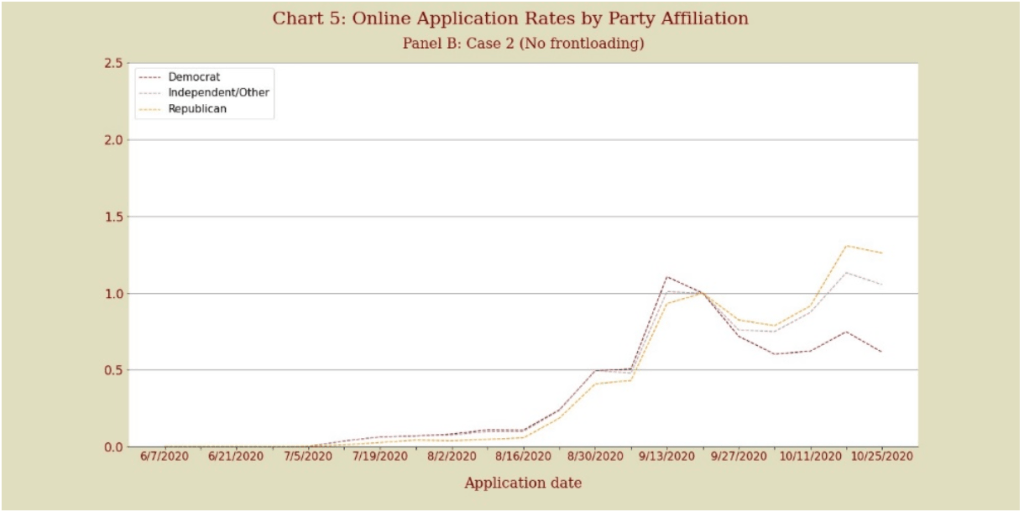
Therefore, whatever caused the late summer surge in paper applications from Democrats in most counties was not present in the case of online applications or in the case of the “hold-out” group represented in Panel B of chart 4.
Circling back
These weekly dynamics can be mapped back to the pattern observed earlier in the article mail-in ballot for application volumes across the five application periods. Charts 6 and 7 revisit that analysis, now differentiating between the two county groups. Panel A of each chart tracks the volume of applications from Democrat voters, separately for paper and online applications, while panel B does the same for applications from Republican voters.
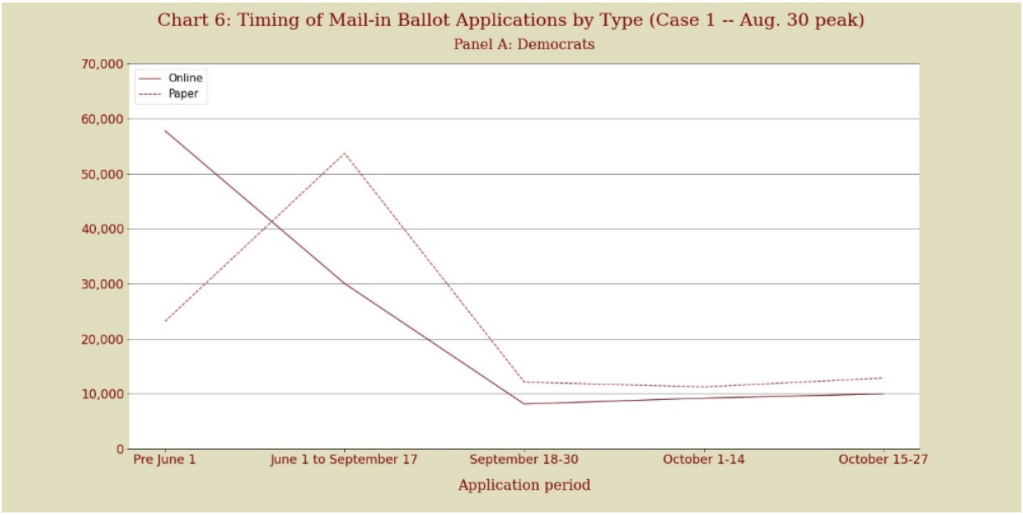

As seen in the two panels of Chart 6, the county group characterized by the August 30 peak is characterized by a steep rise in the volume of paper applications from Democrats between the Primary and summer periods, and the opposite (a large decline) for Republicans. Thus, the comparatively rapid acceleration in paper applications from Democrats during mid to late August in these counties yielded a correspondingly large increase in application volume relative to the Primary.

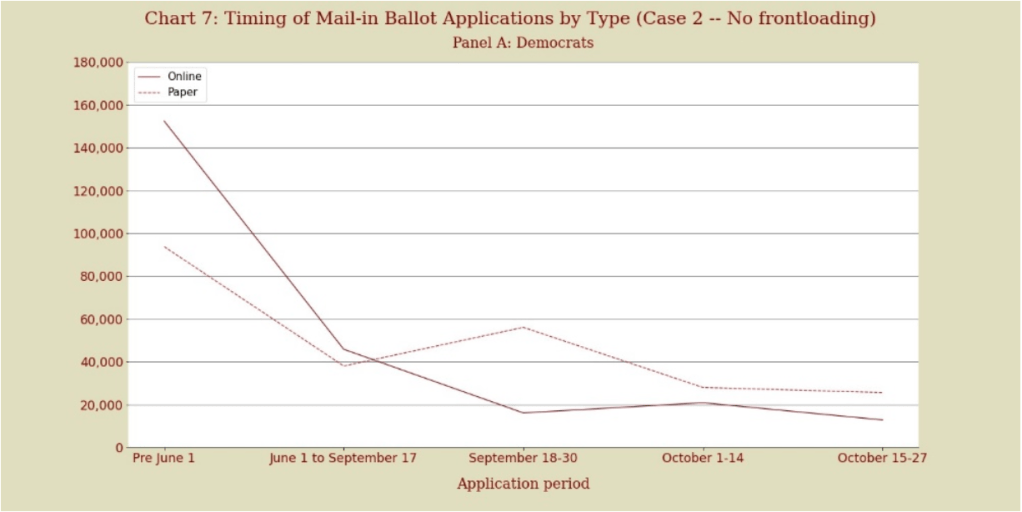
In contrast, as seen in the two panels of Chart 7, the “no front-loading” counties where this rapid acceleration did not occur show a substantial decline in paper applications from Democrats between the Primary and summer periods, comparable to that observed for Republicans.
Thus, it is clear that the statewide aggregate jump in paper applications from Democrats between the Primary and summer periods, described earlier in the chapter, is tied to the counties that experienced a surge in these applications during mid-to-late August. In the case of counties that had no such surge, application volumes across the five periods followed similar paths (only the scaling is different) for Democrats versus Republicans, whether for paper or for online applications.
Summing up
Spikes in the rate of paper applications from Democrats during the last two weeks of August and first week of September, distinct from a more gradual ramping up of paper applications from Republicans, occurred in most Pennsylvania counties. In contrast, the dynamics of online applications were similar between Democrats and Republicans.
It seems implausible that these observed spikes in paper applications from Democrats were voter-initiated. In other words, it is difficult to imagine that among Democrat voters, enthusiasm for Biden, the impulse to get an early start, and the inclination to use a paper application simultaneously surged to generate these unique dynamics. If that were the case, why would the zeal have been confined to filing paper applications, while those preferring the online channel lagged behind? Moreover, how would one then explain the presence of a “holdout” group of 18 counties exhibiting no such wave of enthusiasm?
Therefore, we can be fairly certain that the impetus came from the supply side. In other words, some form of application harvesting in the counties exhibiting the spikes almost surely drove these dynamics. However, the particular activities responsible for the spikes, and the number of additional votes that resulted, have not been determined.
And as for the impact on the election outcome? On the one hand, undoubtedly some of the paper applications “harvested” during the summer period would have been from individuals who would have voted anyway, by applying for a mail-in ballot later on or voting in person. On the other hand, almost surely some would have been from individuals who might not have voted at all if not for the harvesting activity, implying some effect on the election outcome. Based on the data presented here, it is reasonable to conjecture that this effect was material.

Leave a comment